Showing value labels in visualizations
You can show value labels in line visualizations and line and column visualizations so that the data values are clearer.
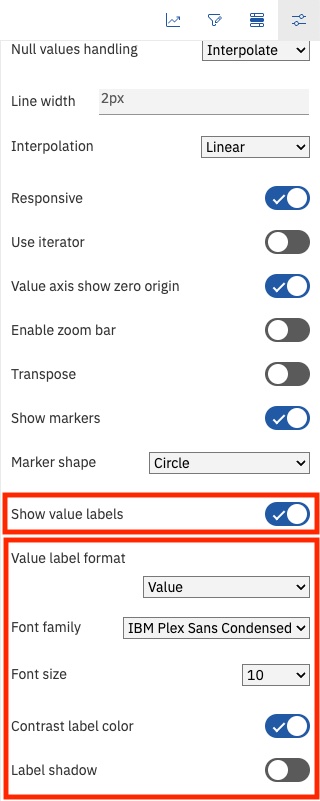
In the Properties icon ![]() , click the corresponding
Show value labels toggle for the line visualization or line and column
visualization. By default, these visualizations do not show value labels.
, click the corresponding
Show value labels toggle for the line visualization or line and column
visualization. By default, these visualizations do not show value labels.
For line visualizations, enable Show value labels to show the value of each data point on the visualization. You can also customize the format of the value labels.
For line and column visualizations, enable Show column value labels to show the value of each column on the visualization, and enable Show point value labels to show the value of each line data point on the visualization. You can also customize the format of the value labels.

For more information, see Showing labels in visualizations.