Handling missing values in line visualizations
You can specify how line visualizations display missing values.
In line visualizations and line and column visualizations, specify how lines display
missing values on the visualization by selecting a value in the Null values
handing dropdown in the Properties icon ![]() .
.
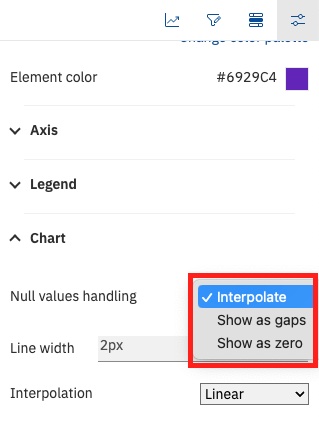
- Interpolate
- The line displays an interpolated value based on adjacent data points. This is the default selection.
- Show as gaps
- The line displays a gap between the adjacent data points.
- Show as zero
- The line displays missing values as zero.
For more information, see Customizing null values for lines.