SVG basic mapping
You map between an element in an SVG and a value in a dataset by adding the value from
the dataset as a new attribute called data-cv-key for the corresponding region in
the SVG.
Note: You can also use third-party tools, such as Inkscape, to annotate SVGs. For more information,
see Using Inkscape to annotate schematics for use in IBM Cognos
Analytics at
https://community.ibm.com/community/user/businessanalytics/blogs/marco-maas1/2019/12/20/using-inkscape-to-annotate-schematics.
Mapping is supported on the following elements:
- Circle
- Ellipse
- Line
- Path
- Polygon
- Polyline
- Rect
- Text
- SVG
- G
Note: The G element is non-visual and is designed to group visual elements together to create a
composite element.
The behavior for other SVG elements is undefined.
The following SVG file does not have the data-cv-key attribute set for the
circles:
<?xml version="1.0" encoding="UTF-8"?>
<svg height="40" width="100" xmlns="http://www.w3.org/2000/svg">
	<g>
		<circle cx="10" cy="10" fill="#cd5c5c" r="10"/>
		<circle cx="30" cy="10" fill="#fa8072" r="10"/>
		<circle cx="50" cy="10" fill="#e9967a" r="10"/>
		<circle cx="70" cy="10" fill="#ffa07a" r="10"/>
		<circle cx="90" cy="10" fill="#dc143c" r="10"/>
	</g>
	<g>
		<circle cx="70" cy="30" fill="#adff2f" r="10"/>
		<circle cx="10" cy="30" fill="#ff0000" r="10"/>
		<circle cx="30" cy="30" fill="#b22222" r="10"/>
		<circle cx="50" cy="30" fill="#8b0000" r="10"/>
	</g>
</svg>
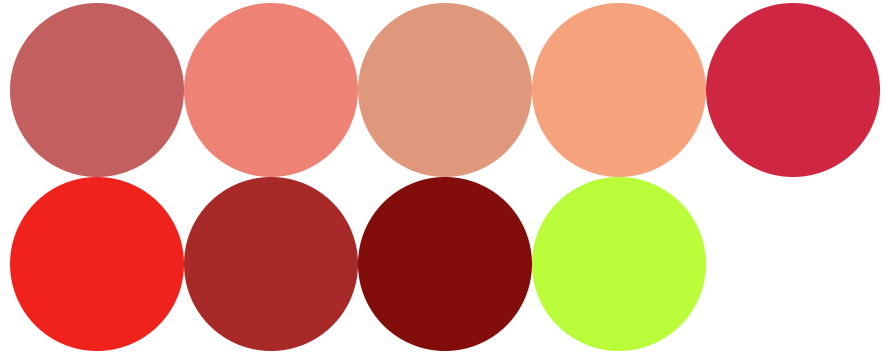
If you would load this visualization, it would display as follows. Mapping to data is not possible.
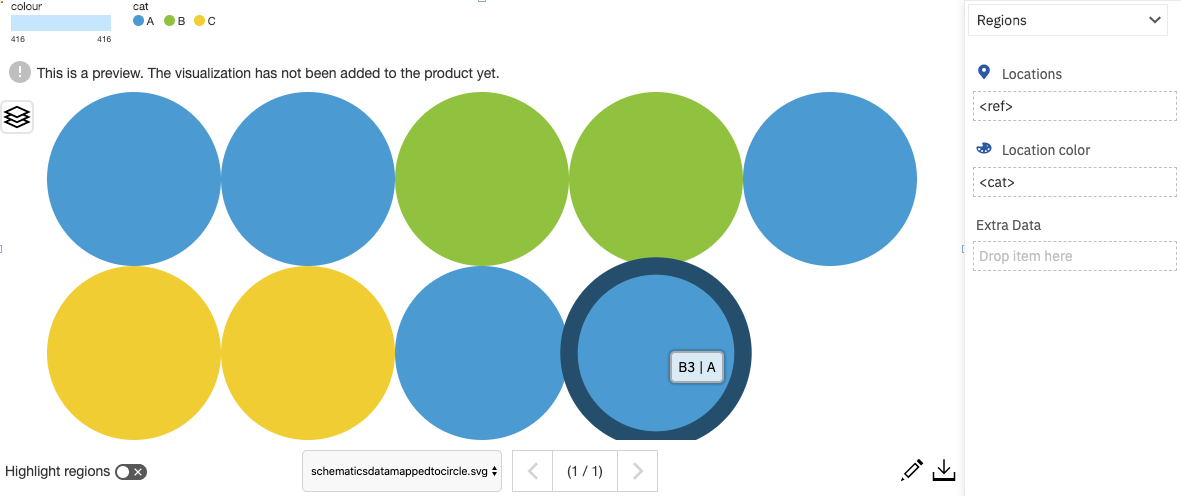
If you add the data-cv-key attribute to the SVG, then you can map data to the
circles in the SVG.
<?xml version="1.0" encoding="UTF-8"?>
<svg height="40" width="100" xmlns="http://www.w3.org/2000/svg">
	<g>
		<circle data-cv-key="A2" cx="10" cy="10" fill="#cd5c5c" r="10"/>
		<circle data-cv-key="A3" cx="30" cy="10" fill="#fa8072" r="10"/>
		<circle data-cv-key="A4" cx="50" cy="10" fill="#e9967a" r="10"/>
		<circle data-cv-key="A5" cx="70" cy="10" fill="#ffa07a" r="10"/>
		<circle data-cv-key="B2" cx="90" cy="10" fill="#dc143c" r="10"/>
	</g>
	<g>
		<circle data-cv-key="B3" cx="70" cy="30" fill="#adff2f" r="10"/>
		<circle data-cv-key="B4" cx="10" cy="30" fill="#ff0000" r="10"/>
		<circle data-cv-key="B5" cx="30" cy="30" fill="#b22222" r="10"/>
		<circle data-cv-key="D1" cx="50" cy="30" fill="#8b0000" r="10"/>
	</g>
</svg>
And the following data:
| ref | cat | color | occupied | size |
|---|---|---|---|---|
| A2 | A | 72 | no | 157 |
| A3 | A | 36 | no | 684 |
| A4 | B | 12 | yes | 325 |
| A5 | B | 22 | no | 186 |
| B2 | A | 16 | yes | 487 |
| B3 | A | 78 | yes | 560 |
| B4 | C | 74 | yes | 871 |
| B5 | C | 87 | no | 980 |
| D1 | A | 19 | yes | 574 |
If you use this SVG and drag ref to the Locations data slot and cat to the Location color data slot, then the color of the circles is mapped with the cat data.