Synchronous invocations
You can obtain Application Response Measurement (ARM) performance statistics from a simple Service Component Architecture (SCA) call to a service and the response from the service.
Parameters
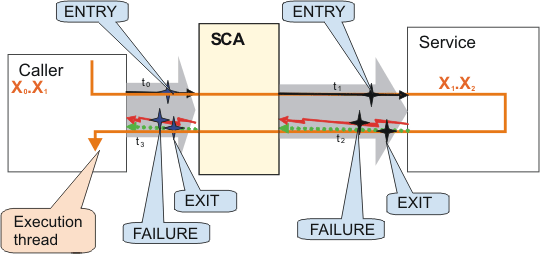
Event monitoring for SCA components includes the event points that are shown in black  , while the event points shown in blue
  are used only to calculate and fire PMI/ARM statistics.
In Table 1 and Figure 1, the
current
ARM transaction (denoted as X1) is created when the
calling service component was invoked for the first time. If the caller is not a service component,
the current ARM transaction is used, or a new one is created. If it is not the starting transaction
then it has a parent, as represented in the following table and diagram with the notation
Xn.Xn+1. The notation is used to document the transaction
lineage. Every SCA invocation starts a new transaction, which is parented by the current transaction
of the caller. You can create new transactions and you can access the current transaction, but they
do not modify the SCA transaction lineage.
| Statistics | Formula | ARM Transaction |
|---|---|---|
| TotalResponseTime | t3 - t0 |
X0 .X1 |
| RequestDeliveryTime | t1 - t0 |
X1 .X2 |
| ResponseDeliveryTime | t3 - t2 |
|
| GoodRequests | CountEXIT |
|
| BadRequests | CountFAILURE |
|
| ProcessTime | t2 - t1 |
