- Before you can import a log file, you must first create a project.
From the toolbar at the top of the workbench, click File –>
New –> Project (see Figure 1). Figure 1. Creating a project

- The New Project page is displayed, similar to Figure 2, offering
several wizards to create various project resources. Figure 2. Selecting the General Project resource to create a project

- Click General –> Project and then click Next.
- Enter a name for the new project, for example, ITWSN_SampleProj.
Verify that the Use default location check box is selected,
and click Finish.
The new project is created and then displayed in the Navigator view on the workspace. Figure 3 shows the resulting project in the Navigator view, after expanding the folder icon to show the project.
Figure 3. The new project displayed in the Navigator view
- Now that you have a project created, import the sample log file.
From the toolbar at the top of the workbench, click File –>
Import.
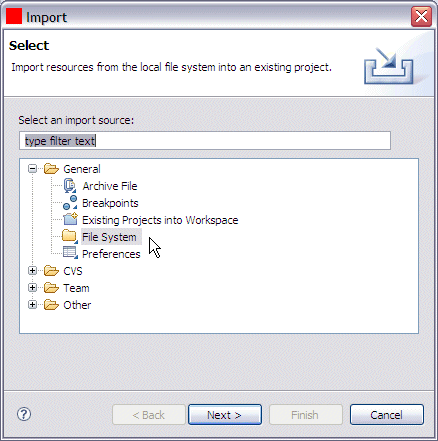
The Import page is displayed, similar to Figure 4. Use this page to import resources from several different sources.
Figure 4. Selecting the file system import resource option to import the local sample log file
- On the Import page, click the General –> File system import
source, which is used to import a log file that is stored locally
on your workstation. Click Next.
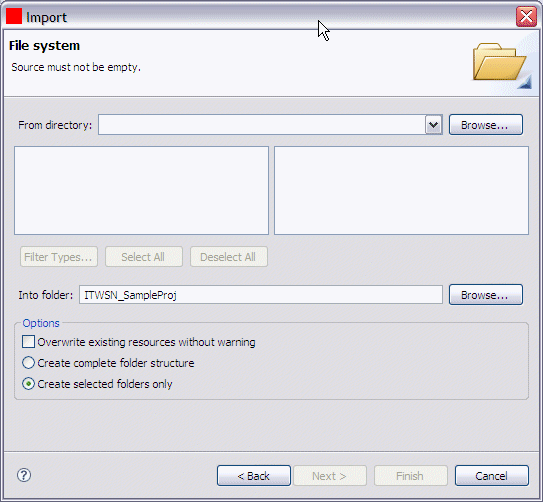
The Import File system page is displayed, as shown in Figure 5. This page is where you specify the location of the log file to be imported.
Figure 5. The Import File system page
- Click Browse to navigate to the target directory where
you installed the product, for example, C:\Program Files\IBM\ITCAM for SOA 7.2\Tools.
Select the \IWSNavigator\samples folder
and click OK.
You are returned to the Import File system page. You can select either the entire \samples directory, or just a single file, for example, samples.log.
- For this example, select the check box for the single samples.log file.
- In the lower portion of the Import File system page, you are prompted
to specify the folder into which the samples.log file is to be imported.
For this example, the ITWSN_SampleProj target folder is already
specified.
If the preferred folder name is not displayed in the Into folder field, click Browse to launch the Import Into Folder page. On the Import Into Folder page, select the preferred target folder, for example, ITWSN_SampleProj, into which the log file is to be imported, and click OK. You are returned to the Import File system page.
- In the Options area, you can select additional options
to overwrite existing log files in the same folder, create the complete
folder structure similar to where the selected log file is located,
or create only the selected folders under the selected project. For
this example, accept the default setting, Create selected folders
only.
Figure 6 shows the resulting Import File system page with the specified log file to be imported.
Figure 6. Selecting the samples.log file
- Click Finish to import the sample log file in to the Navigator view of the IBM Web Services Navigator workspace. The log file is placed under the new ITWSN_SampleProj project name in the Navigator view.
- To view the data in the imported log file, double-click the samples.log
file name in the Navigator view.
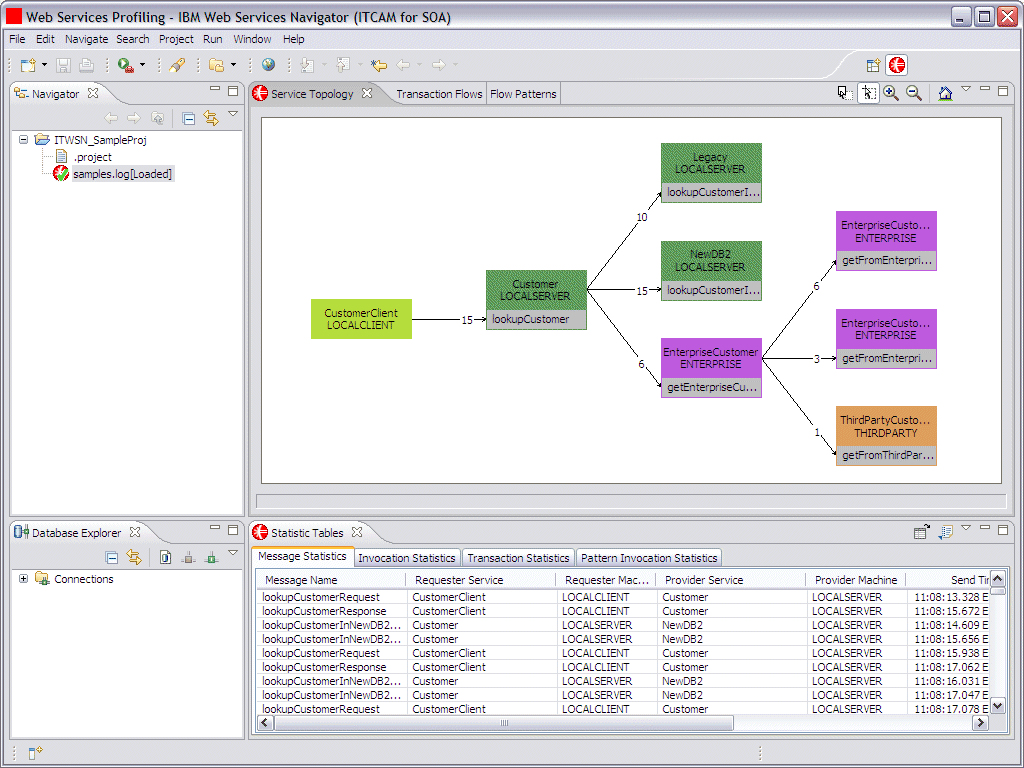
The Service Topology view and the Statistic Tables view are populated with the data from the log file, as shown in Figure 7 In the Navigator view, the samples.log file is marked with both a check mark icon and the suffix [Loaded] appended to the file name. These symbols indicate that the log file is loaded in to the perspective.
Figure 7. The sample log file loaded in to the views.
The Service Topology view displays the logical topology of the nodes involved in the Web service transactions.
- Click the Transaction Flows tab. Repeatedly press the greater than (>) key to zoom in on the path sequence diagram to view the path sequence of the Web services in the sample log file. Repeatedly press the less than (<) key to zoom out again. Additional controls are described in the online help system.
- To see a different view of the sample
data, click the Flow Patterns tab, as shown in Figure 8 (you might
need to zoom in on this view, and drag the edges of the view to adjust
the size in the workbench window). This view shows each unique transaction
path and the number of times that specific path occurred in the sample
data. Figure 8. The Flow Patterns view

- In the Statistic Tables view, the Message
Statistics table is displayed by default. Click a row in the table
data to highlight the row in yellow. Depending on the row that you
select, you might see a corresponding portion of the Flow Patterns
view also highlighted in yellow, similar to the example shown in Figure 9. Figure 9. Highlighted data displayed in both the Message Statistics table in the Statistic Tables view and the Flow Patterns view

Notice in Figure 9 the broken yellow highlighting in the Flow Patterns view. This signifies that a subset of the transactions represented by that flow have been selected in another view. If you scroll through the table in the Statistic Tables view, you might see one or more rows highlighted in yellow in the table, but there are additional rows associated with this flow that have not been selected. If you click the transaction in the Flow Patterns view, the broken yellow line becomes a solid line, meaning that all transactions represented by that flow have been selected. You can now scroll through the Statistic Tables view and see all of the associated rows highlighted in yellow.
- With a row highlighted
in the Message Statistics table view, click the Open Content icon
in the Statistic Tables toolbar and select Open Content. The
Message Content view opens as a new view in the same view space as
the Statistic Tables view. Figure 10. The Message Content view

The Message Content view is unique to the other views in the Web Services Profiling perspective in that it displays the content of intercepted messages. The other views display metric data about the Web services. You cannot retrieve message content data from the warehouse database, where other Web services metric data is stored. Additional steps are required to capture message content data and convert it into a log file suitable for importing in to the Message Content view.
See Retrieving local metric and content log files for more information about obtaining message content data to display in this view.
If you can successfully display these various views of the data from the imported sample log file, then IBM Web Services Navigator is successfully installed.
If the installation of IBM Web Services Navigator was not successful, see Troubleshooting for more information.