Technical Blog Post
Abstract
What's new in October 2017
Body
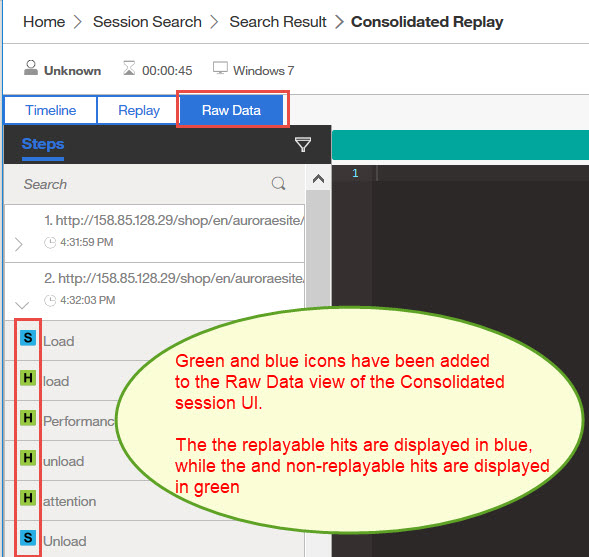
How do you know if a session is replayable?
We added icons to the Raw data view in the Consolidated Session UI. These two icons help you determine whether the session is re-playable:
| Icon | Description |
| Session is replayable | |
| Non-replay-able hit |
|
|
New search capability in the Consolidated Session UI
You can search for steps, pages, and UI gestures in the Raw Data view and the Replay view in the Consolidated Session UI. If the navigation list contains a lot of items, you can use the Search feature to quickly locate what you are looking for, without having to scroll through an extensive list.
| Replay search: | Raw data: |
|
|
|


Click here to get need more information on the Consolidated Session UI.
New report for Tealeaf/ Akamai integration
A new ready-to-use report tracks the number of billable hits flowing from the Akamai Content Delivery Network (CDN) to IBM Tealeaf on Cloud. Billing is based on a million monthly interactions (MMI) metric. IBM Tealeaf on Cloud users can use the report to track Akamai data usage and modify their Akamai integration strategy as necessary.
Example report:
 |
Improved session replay quality
We just improved session replay by adding support for scroll events. Support for scroll events allows you to observe visitors scrolling in your web or mobile-web applications. Support for replaying scroll events is achieved by configuring a SimulateUIEvents replay rule text file, as follows:
<HostProfile name="www.abc.com">
<SimulateUIEvents value=".*" uiEvents="scroll"/>
</HostProfile>
Where the <HostProfile name> is the name of the web site or application that you are replaying. When you are done configuring the replay rule text file, you can upload it from the Company Settings page (you must have admin privileges to access Company Settings):
From Company Settings:
 |
Then,
 |
Note: Only those scroll events that occur from within the main window area are displayed in replay. Scroll events that occur in nested frames (iFrames) within a page, are not supported in replay.
Improved reports in Struggle Analytics
We added median step time and median load time to the report. Here is an example:
 |
Labeling in reports
You can now assign your own meaningful labels to the X and Y axis in reports. This makes your reports easier to read. Go to the report, and simply click Axis setting to get started.
 |
Then enter Label and Unit for each axis.
 |
Information added to the user interface to facilitate uploading hybrid assets
When users upload hybrid assets, they need to specify the Application name and Version.
Prior to the October release, the Application name and Version were not exposed in the Consolidated Session user interface, making it harder to complete the procedure of uploading hybrid assets.
The Consolidated Session UI includes 2 new fields that provide the Application name and Version:
 |
UID
ibm11122435