Technical Blog Post
Abstract
IBM Case Manager 5.2.x - Performance Optimization of Case Visualizer and OOTB reports
Body
Authors: Ranjeeth Pasupathi and Uday K Cholleti
Abstract
Analytical and Reporting tools make the most sense when they provide the desired insights taking into account the most recent data. The speed in which these tools operate is decided based on how well they are tuned. IBM Case Analyzer and IBM Case History caters statistical and historical insights into customer cases. This artilcle focuses on achieving the maximum out of these components in terms of performance and scalability.
Introduction
IBM® Case Manager (ICM), the advanced case management solution from IBM, unites content, processes and people to provide a 360-degree view of a customer case and to optimize case outcomes. IBM Case Analyzer is an integral component of ICM, which provides statistical reporting capabilities for an ICM deployment. IBM Case History is another integral component that helps visualize extended history of a single case from its start to end.
Case Analyzer and Case History share a common framework and runs as a set of threads within the Content Platform Engine (CPE). The framework controls the execution of the tasks that export the data from the Content Engine audit log and the Process Engine event logs (CPE Database) to populate the target Case Analyzer RDBMS store and Case History RDBMS store.
Since CPE 5.2, Case Analyzer and Case History are enabled to run in an application server and a common framework was built to make it robust and flexible to satisfy the needs of the customer environment. The framework contains default parameters that might not suit all customer needs. Therefore, tuning these parameters based on hardware capacity and scalability or performance needs of the customers can enable optimal output from Case Analyzer and Case History components.
Tuning is based on the following parameters:
- Hardware capacity
- Expected magnitude of data inflow
- Number of event logs to be processed
- Number of stores created
- Expected latency in end reports or widgets
This article will provide basic information of the shared framework, the concept of tasks, threads and event logs and will elaborate on each of the tuning parameters. The article will guide you on how and where to tune these parameters with examples. The best practices section will discuss a scenario and provide guidelines to tune these parameters.
Shared framework
IBM Case Manager client applications use the services offered by the IBM Content Platform Engine (CPE) for its operations. The CPE server provides the framework and implementation of content, process and event extraction and publishing services. IBM Case Analyzer and IBM Case History are part of the event extraction and publishing services framework. They use the framework services to extract data from the audit logs, process them and publish the data onto the target RDBMS stores. Event publishing and exporting framework is called by the name Event Exporter framework.
The event exporter framework controls the tasks, threads and stores thereby taking care of managing the data collection and publishing of each of the configured stores. The framework is dynamic in nature that allows for performance and scalability tuning by altering the framework parameters. The framework also enables the sharing of load between the different nodes of the cluster.
Tasks, threads and event logs
At its core, the event exporter framework picks up an available store for processing and submits the tasks to a set of worker threads. Understanding the concept of tasks, threads and event logs will help in tuning the appropriate parameters for performance and scalability.
Tasks
Tasks are work objects that carry out the work of collecting and publishing when given a chance to execute. For each store, the tasks are divided into a set of collectors and publishers. Collectors extract the data from the source event log and feed them into shared publisher buckets. Publishers pick these events from the queue, process them and publish them in the RDBMS.
When a collector task gets a chance of execution within a worker thread, it picks up the next event log for the store and starts the extraction of a batch of events. Once this is done, it picks up the next event log and continues with event extraction. This continues until the time given for the task to execute expires.
When a publisher task gets a chance of execution within a worker thread, it picks up the next bucket of events and processes them. Similar to collector tasks, if the processing of the current bucket is complete, the publisher task picks up the next available bucket for processing.
At the end of every publishing interval, the processed events are committed to the RDBMS store.
Threads
Threads are execution units. With respect to the Event Exporter framework, they execute the tasks. During initialization, the framework creates a collector thread pool and a publisher thread pool. Collectors and publishers are submitted to the collector thread pool and publisher thread pool respectively.
Event logs
Case Manager is installed on top of a Content Platform Engine. A single installation can have one Case History store and one Case Analyzer store or more. An exporter store fetches data from one Content Engine audit log and one or more Process Engine event logs. During initialization the source event logs are validated and initialized. These event logs are input to the collector tasks and during execution, the collector tasks pick the next available event log for processing.
Tuning parameters
Based on the different factors mentioned in the introduction section, users can consider tuning the parameters to achieve better processing rate and overall performance.
Parameters to be considered for tuning are:
- Number of collector and publisher tasks
- Number of collector and event exporter (publisher) threads
- Query batch size
- Event queue threshold
- Publishing interval
- Store accounting interval
- Store lock sleep duration
On a multiprocessor system, tuning the above parameters can improve the publishing rate. Ensure that the following conditions are met.
- Precautionary evaluation to ensure disk I/O and the database are not bottlenecks
- Monitor processor utilization to ensure it is not approaching 100 percent
- Sufficient memory is available
Tasks
Collector tasks: The number of collector tasks should be configured based on the number of event logs to be processed.
Publisher tasks: The number of publisher tasks should be configured based on the magnitude of events from different cases so as to enable higher throughput.
Threads
Collector and publisher thread pool size depends on the corresponding number of tasks. Each thread executes one task at a time. Hence, one thread per task is an appropriate configuration.
Important: Increasing the thread pool size should be done taking into account the resources of the system where the CPE engine is deployed.
Query batch size
CA/CH queries the events from the source event logs in batches. Query batch size determines the number of events to be queried from the event log per instance of data collection.
Event QueueThreshold
Events that are collected by the collectors are fed into a set of publisher buckets for processing. Collection is blocked when a bucket is full and hence the size of these buckets should be sufficient and coherent to the query batch size that is configured.
Publishing interval
Publishing interval specifies the time duration during which the events are processed and retained in memory. At the end of every publishing interval, event processing stops, the store commits the data onto the RDBMS. Once the RDBMS update is completed, the store switches back to the event-processing mode.
Publishing interval should be configured based on how frequently the RDBMS needs to be updated to get the latest data on the reports and dashboards. It is important to note that for a store that has a large backlog of events to process, publishing interval should be a larger value so as to give the store more time to process the events.
Accounting interval
Event exporter framework does accounting of stores in a CPE domain periodically to check for their status and coordinates store processing between the various nodes of a cluster. The quicker a store is accounted for, the earlier the processing starts for that store.
Caution: Altering this parameter to a value smaller than the default value will increase the CPU utilization drastically. This parameter should be configured with caution preferably with the help of support personnel.
Lock store sleep duration
When there are no new incoming events to be processed, a store goes to sleep. The duration to sleep is controlled by the Lock Store Sleep duration parameter. If new events are generated in discrete intervals, reducing the sleep time of the store can ensure new events are processed with minimal delay.
Caution: Altering this parameter to a value smaller than the default value will increase the CPU utilization drastically. This parameter should be configured with caution preferably with the help of support personnel.
How To add tuning parameter
Few of the tuning parameters can be set and modified using the Administration Client for Content Platform Engine (ACCE). The rest can be tuned by directly adding or updating records into the store configuration tables within the RDBMS.
This section describes how to add or update a tuning parameter value in the configuration tables. Case analyzer stores the parameters in a table called X_CAProperties. Case History stores the parameters in a table called CH_X_Properties.
Below table summarizes the parameters that can be tuned using the configuration tables.
| Parameter | Case Analyzer (X_CAProperties) | Case History |
| Collector tasks | analyzer.collectorTaskCount | history.collectorTaskCount |
| Publisher tasks | analyzer.publisherTaskCount | history.publisherTaskCount |
| Query batch size | analyzer.cpe.querybatch | history.pedb.querybatch history.cedb.querybatch |
| Event queue threshold | analyzer.eventQueue.threshold | history.eventQueue.threshold |
| Publishing interval | analyzer.heartbeat.interval | history.heartbeat.interval |
Note: Case History uses different query batch sizes for PE and CE events, which are specified as two separate parameters.
To alter a specific parameter on Case Analyzer store, use the below syntax:
Listing 1. Sample update statement for Case Analyzer
UPDATE X_CAProperties
SET <param_value> = <desired_value>
WHERE <param_name> = '<desired_param_name>';
To alter a specific parameter on Case History store, use the below syntax:
Listing 2. Sample update statement for Case History
UPDATE CH_X_Properties
SET <param_value = <desired_value>
WHERE <param_name> = '<desired_param_name>';
Ensure the schema/owner name is prefixed to the table name in case the user default schema is different from the one that contains the store tables.
Other parameters not mentioned in the above table can be configured using ACCE:
CPE Domain → Properties → Subsystem Configurations → PE Subsystem configuration
- Maximum Event Collector Threads
- Maximum Event Exporter Threads
- Store accounting interval
- Lock store sleep duration
Figure 1. Configuring PE sub-system (1)
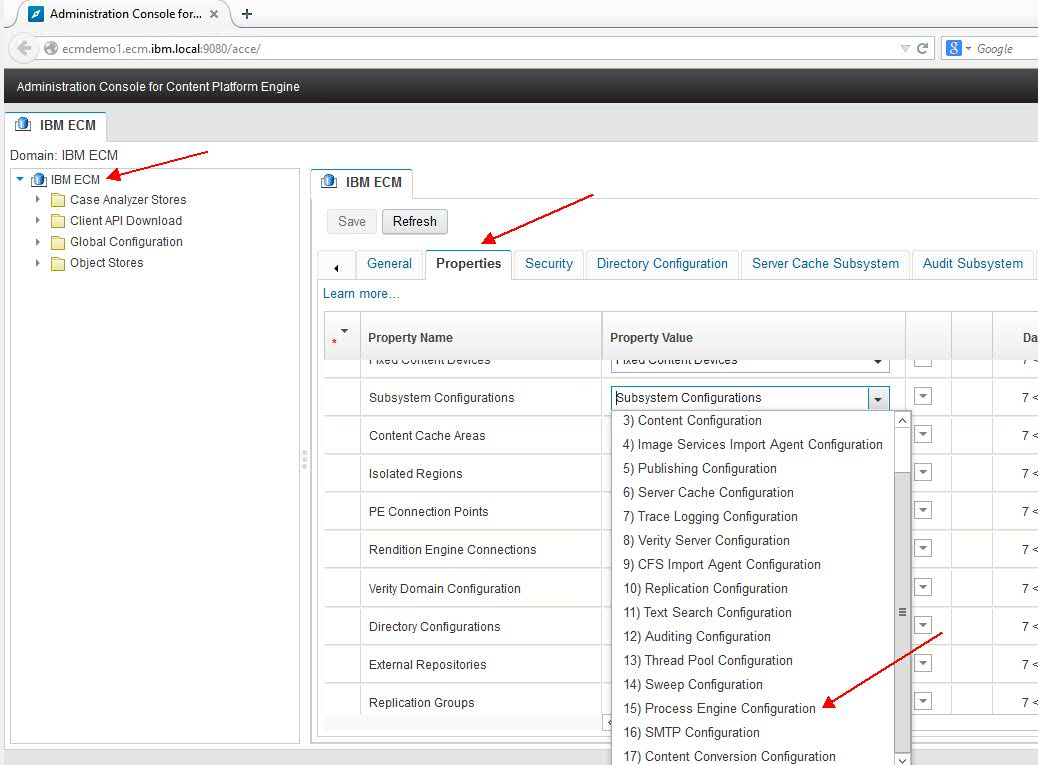
figure1.jpg
Figure 2. Configuring PE sub-system (2)
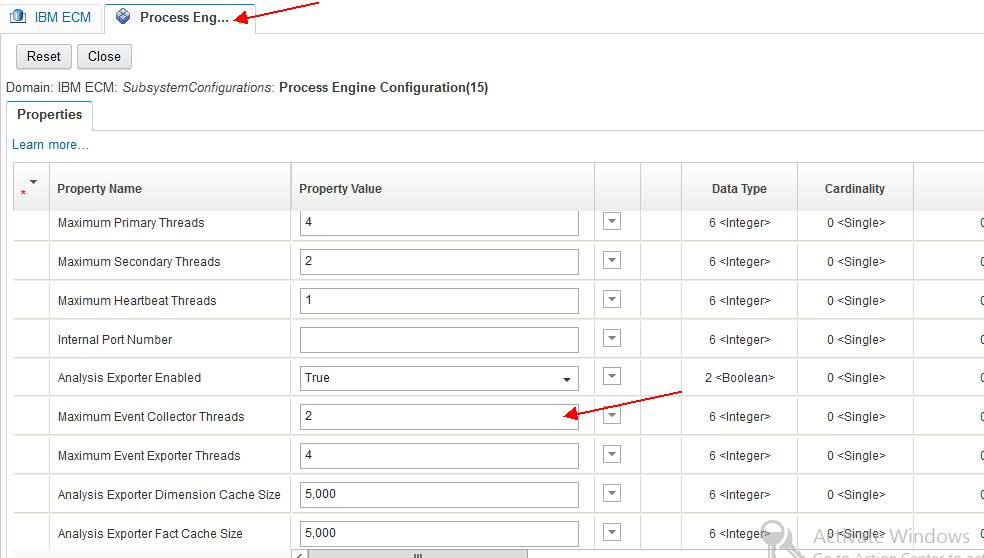
figure2.jpg
Monitoring
- IBM System Dashboard for Enterprise Content Management can be used to monitor the event publishing rate of Case Analyzer and Case History stores by adding the corresponding site details of CPE system.
Event publishing rate can be monitored by navigating to the below node of each individual store:
<Store> → 'Data publishing' → 'Events Published'
Figure 3. Monitoring statistics via IBM system dashboard

figure3.jpg
- Process Engine Server Information (Ping Page) of CPE system provides useful information about the eventexporter stores, their status and corresponding collector and publisher tasks.
Process Engine server ping page can be accessed using the below URL format: http://<CPE server ip>:<portnumber>/peengine/IOR/ping
Figure 4. Monitoring system state using Process Engine ping page

figure4.jpg
Best practices and scenarios
Performance and scalability tuning is best achieved by studying the requirements of the customer environment. Consider an environment with the following needs:
- Two Case Analyzer stores and one Case History store
- Five PE event logs and one CE event log for every store; all event logs are active with inflowing events
- Maximum of 10 minutes delay between the live events in CE/PE and the data that is published in CA/CH store
- Approximately, 1000000 events to be published on a single day
- No limit on hardware resources
Given the above information, we can deduce that there are totally 18 logs to be processed by the system at any given point in time. For each store there are six logs from which the events are to be collected.
Optimizing data collection
First step in tuning the exporter stores is to optimize the data collection speeds.
- Assign six collector tasks to each store
- Assign 18 collector threads to the global parameter
- Set the query batch size to 1000
- Set the event threshold parameter to 1000
By having 18 collector threads working in parallel and 18 collector tasks (six for each store) available, collection will be a continuous activity without any waiting time for resources. At any given time, the collector tasks will continuously run in one of the threads and pick up the logs for processing without any wait time.
In order to save system resources, a few tests with varying collector threads and tasks can be used and there is a high chance that the same performance can be met with a lower number of tasks or threads. A good number would be starting with 50 percent of the number of tasks and threads and then increase it to the maximum. In this case start with nine collector threads and three collector tasks for each store and then increase the number up to the maximum number of 18.
Optimizing data export and publishing
In the previous sections, it was discussed that the collectors will collect the events and put them into the publisher buckets. The number of publisher buckets is equal to the number of publisher tasks that is configured for each store. Based on the quantity and speed of incoming event load, an appropriate number of publisher tasks and threads should be configured for efficient data publishing.
Event collectors select the bucket into which the events are pushed. To maintain data consistency, the events pertaining to a same Case or Workflow are pushed into the same bucket in the increasing order of sequence number. Given this fact, the number of publisher tasks should be selected based on the following points:
- If the customer is working on a fewer number of cases or workflows with a lot of activity happening with these cases and workflow, then fewer number of publisher tasks should be created.
- If the customer is working on a large number of cases or workflows, with lesser activity on each of them, a larger number of publisher tasks needs to be configured.
Similar to collector configuration, publishing configuration should be tuned incrementally. Given six collector tasks or logs, the starting point should be four publisher tasks. So in the given example, it would be four publisher tasks for each store and 16 exporter threads in order to keep the publisher tasks continuously busy. Publisher tasks should be increased incrementally in steps of two with and without increasing the number of publisher threads to identify the optimal tuning values for the target environment.
Batch sizes
The CE/PE query batch sizes and the event queue threshold sizes should be coherent.
General recommendation on auditing
Auditing provides a mechanism to monitor event activity and act as a source for Case Analyzer and Case History. Carefully choosing the type of events to be audited is part of the performance and scalability tuning exercise. By limiting the audit events to the minimal requirement, the query performance of Case Analyzer and Case History can be greatly improved; the same applies to the number of custom properties that are audited.
Conclusion
Performance and scalability tuning is an exercise that is carried out with a few sample configurations in a non-production environment to identify the best fit. There are no hard and fast rules and configuration settings that can achieve the optimal performance in any given environment. This article explains the various tuning parameters, its relation with the product run time and details on how and where these can be modified. Best practices section provides a sample configuration with an example which can be a starting point for any tuning exercise that involves Case Analyzer and Case History.
About Authors:
Name: Ranjeeth Pasupathi
Job Title: Advisory Software Engineer
Email: rpasupat@in.ibm.com
Bio: Ranjeeth is a proficient author of multiple technical articles in the area of case, content and process management domains. He is a developer and SME for IBM Case Manager reporting components with more than 10 years of technical expertise.
Company: IBM India
Name: Uday K. Cholleti
Job Title: Software Engineer
Email: uchollet@in.ibm.com
Bio: Uday is a developer currently working with Case Manager reporting components and has more than seven years of technical expertise on IBM FileNet products.
Company: IBM India
UID
ibm11281076