Technical Blog Post
Abstract
An Example for RTM 10.2.1 and ICM 5.2 Integration: how to customize monitor reports with user-defined properties
Body
Author: Elven Tang (xiaoqiut@cn.ibm.com), ICM/BPM FVT engineer.
As it is known, IBM Case Manager (ICM) can simplify the design and implement of a case management system and make case workers manage cases easily by providing a graphical user interface, which unites information, process, and people to provide a 360-degree view of case information. Additionally, in order to achieve real-time business monitoring, timely business trend analysis and quick decision, ICM can also integrate with Cognos Real-time Monitoring (RTM) to provide the near real-time monitoring on case related activities. In this blog, we will generally introduce the integration between ICM 5.2 and RTM, and give a simple use case to demonstrate how to implement this integration in a real user scenario.
First of all, let’s generally introduce the Cognos RTM which is formerly known as Cognos Now!. RTM represents a continuous cycle of business optimization exemplified by the gains made by a continual monitoring of operational KPIs. It can expand the organization‘s immediate information usage across the operations and drive faster and higher impact decisions, and actions across your entire frontline every minute of the day. As the following chart shows, RTM can access the external data sources such as DB, workflow, etc. by agents, and users can define views, cubes and alerts to monitor the KPIs from RTM workbench. On the other hand, from RTM dashboards, we can design charts in various types based on the configurations in workbench, and finally get the required graphical monitor results which reflect your system or business status in near real-time. In a word, the roles-based dashboards, smart workbench and embedded report capability provided by RTM can make ICM system more competitive on analytics field.
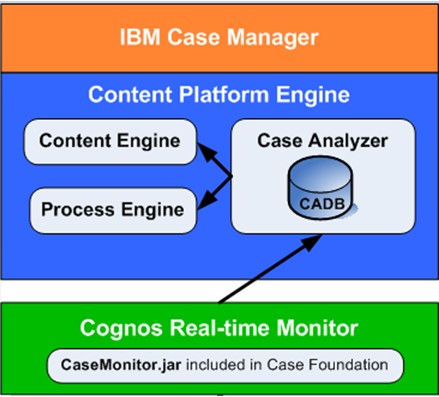
Secondly, let’s go through the integration part, the following chart shows the architecture of ICM and RTM integration. In this picture, we can see that ICM 5.2 is base on Content Platform Engine (CPE) which consists of Content Management and Business Process Management. All the solutions, cases, tasks, etc. in ICM are stored and managed by CPE. Case Analyzer (CA) which integrated in CPE can capture the events of CPE and store them in its own CADB. RTM is an operational business intelligence solution deployed on application server, which can access the data stored in CADB and visually display them based on specific user requirement for quick reaction to business trends and opportunities.
In the following section, we will provide a simple user scenario, and demonstrate how to use RTM to get ICM related analysis reports based on the specific user requirement.
In this scenario, the manager of a company wants to monitor the sales performance of each product type so that he can learn about the marketing requirement and determine which type should be focused on in the follow-on production. This company has introduced ICM in their whole sales management system, so the required data like product type, sales amount, and sale quantity are all stored in CPE. Then we can follow the steps below to implement this requirement with integration between ICM and RTM.
Firstly, there should be 3 case properties which have been defined in the sales management solution deployed in ICM.
| Property Name | ProductType | SalesAmount | SalesQuantity |
| Property Type | String | Float | Integer |
Then, we need to specify case properties to Audit by using the audit configuration wizard in the ICM administration client.
1. Start the ICM administration client using the following URL:
http://<ICN server name>:<port>/navigator/?desktop=icmadmin
2. Select the design object store and click Solutions in the left pane.
3. Select the sales management solution on the Solution page.
4. Click Actions in the toolbar and select Configure -> Auditing in the dropdown list.
5. Follow the wizard steps on the Configure Auditing page to create an audit configuration and add the properties ProductType, SalesAmount and SalesQuantity to audit.
6. In the last step, select “Apply audit configuration”, and click Apply button.
Next, we need to expose the case properties on CA Process Task Manager (PTM). Based on the requirement, ProductType should be added to “Case in Progress” and “Task in Progress” cubes as a dimension, and SalesAmount and SalesQuantity should be added to those 2 cubes as measures. Please refer to the following steps:
- Open captm.bat/captm.sh under <CPE installation directory>/tools/PE.
- Right click on the Data Fields folder in the left panel, and choose “New”.
- For ICM monitoring, we should choose the Target ObjectStore as the source for user defined data fields, so select “Use Content Engine field as a template”, click “Next”.
- For the case property ProductType, choose “Dimension” as the type. For SalesAmount and SalesQuantity, choose “Measure” as the type. Then click “Next”.
- Choose “Fact tables only (detailed reports from the Case Analyzer database)”, and click “Next”.
- Select Case in Progress and Task in Progress from “Available Fact Tables” to “Selected Fact Tables”, and click “Finish”.
After the above settings, we need to go to RTM workbench to define data stream, lookup table, view, dimension and cube as below. The following steps are base on that the CaseMonitor.jar installed by Case Foundation installer has been imported to RTM successfully.
- Log on to RTM workbench: http://<RTM hostname>/cognos/realtime/workbench (rtmadmin/manager).
- Modify the Case Monitor data stream object “Case Data Stream” to define data stream.
- On the Workbench tab, expand the IBM FileNet Case Monitor folder and select the Case Data Stream object under Case folder.
- Click “Edit” in the right panel, and modify the JDBC Query as follows. (ET is the prefix of sales management solution in ICM.)
- Click “Resubmit Query”. Notice that sumAmount, sumQuantity and ProductType_key are added to the columns for the event.
- Click “Save Data Stream”.
- Create a lookup table for the ProductType dimension.
- On the Workbench tab, expand the IBM FileNet Case Monitor folder and select the Case folder.
- Click “Activities” in the right panel and click Create New -> Lookup Table.
- Select JDBC for the type of lookup table source, then click “Continue”.
- Select an agent from the JDBC Connection list. For example, you can use the preconfigured agent CADB_JDBC_Agent.
- Enter the following query in Query field, then click “Continue”.

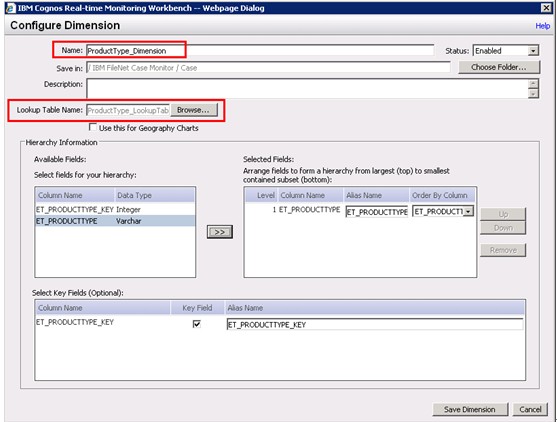
- On the dialog “Configure Lookup Table – JDBC Source”, enter the name “ProductType_LookupTable” for the new lookup table.
- On the Data Caching tab, enable “Cache data for this lookup table”, and clear the “Enable Prefetch” option.
- Set the Invalidation Schedule by clicking “Add Schedule” and set an interval value so that it is never invalidated, for example, once a year on February 31.
- Click “Save Lookup Table”.
- Modify the “Case View” object based on the data stream.
- Expand the IBM FileNet Case Monitor folder, select Case View under the Cases folder, and click “Edit”.
- Add the new fields sumAmount, sumQuantity and ProductType_key.
- Click “Save View”.
- Create a ProductType dimension for monitor.
- Expand the IBM FileNet Case Monitor folder and select the Case folder.
- Click “Activities” in the right panel and click Create New -> Dimension.
- Enter the following values, move ProductType to the Selected Fields table and select the Key Field check box for ProductType_key in the Select Key Fields table.
- Click “Save Dimension”.
- Modify the “Case Cube” object.
- Expand the IBM FileNet Case Monitor folder, select the Case Cube object under Case folder, and click “Edit”.
- On the “Configure Cube” dialog, click “Add Measure Column” to add “Total Amount” and “Total Quantity”, and enter the values as below:
- Click “Add Dimension” to select ProductType_Dimension, and choose ET_ProductType_key as Dimension Primary Key and ProductType_key as Fact Column Foreign Key.
- Click “Save Cube”.
Finally, go to the RTM Dashboard to create a dashboard object for monitor results display.
- Log on to RTM Dashboard: http://<RTM hostname>/cognos/realtime/dashboard (rtmadmin/manager).
- Under Navigation Tree, select “Dashboard Objects”.
- Select the Case folder, click “Create Object”, and choose “Create Dashboard Object”.
- Click “Choose Folder”, and choose “Case”.
- Under Data Source Name, select “Case Cube”, and click “Continue”.
- Select “Chart” as display type, and select “Vertical Combination Chart” as display subtype. Click “Continue”.
- Select Total Amount for Y-Axis, and choose “Column” as the chart type (you can also choose other chart type according to your requirement).
- Select ProductType_Dimension for X-Axis.
- Enter a name for your dashboard object, like “Total Sales Amount by Product Type”, and click “Save”.
- Add the newly created dashboard object to the Case Dashboard.
- Under Navigation Tree, select “Dashboards” and select “Case Dashboard” under Case folder.
- Click “Activities”, and choose Edit -> Edit Dashboard Content.
- Select “Total Sales Amount by Product Type”, and click “Continue”
- You can set a refresh interval for this dashboard, for example, 5 minutes, and click “Save”.
- Repeat the above steps to create another dashboard object “Total Sales Quantity by Product Type”.
With the configuration above, manager can get the following charts to monitor product sales performance. From the monitor results, we can see that Product Type A has the most sales quantity and Product Type C has the most sales amount, which can help manager to learn about the marketing requirement and determine which types should be focused on in the follow-on production.
Besides the basic monitor function for RTM and ICM integration described in this article, RTM can also provide some more advanced functions like threshold monitor and alert for ICM activities. We will introduce the configuration and usage for the advanced functions in the future article.
Useful Links:
RTM 10.1.1 Information Center: http://publib.boulder.ibm.com/infocenter/crtm/v10r1m0/topic/com.ibm.swg.im.cognos.install.10.1.0.doc/install.html
RTM 10. 2 Information Center: http://pic.dhe.ibm.com/infocenter/cbi/v10r2m0/index.jsp?topic=%2Fcom.ibm.swg.ba.cognos.ig_dqa.10.2.0.doc%2Fc_ig_dqa_intro.html
ICM 5.2.0 Information Center: http://pic.dhe.ibm.com/infocenter/casemgmt/v5r2m0/index.jsp
P8 5.2 Information Center: http://pic.dhe.ibm.com/infocenter/p8docs/v5r2m0/index.jsp
IBM Case Analyzer Information Center: http://publib.boulder.ibm.com/infocenter/casemgmt/v5r2m0/topic/com.ibm.casemgmt.installing.doc/acmcp008.htm
UID
ibm11281454


