Technical Blog Post
Abstract
Java Core Debugging using IBM Thread and Monitor Dump Analyzer for Java
Body
Abstract: Problems which cause Java processes to dump threads to a core file can be solved with the help of an IBM DeveloperWorks tool created by Jinwoo Hwang.
Introduction
Some error conditions in an IBM® Java Virtual Machine (JVM) running under IBM WebSphere® Application Server result in a crash. The output of a crash is a Java core file. The Watson Explorer Content Analytics runtime is instrumented to output all running Java threads, at the time of a system-critical error. These core files are written to the Content Analytics/logs directory and are included in the output of the command.
esservice.sh/bat

While it is true that the support team may ask for such files, it is also to do your own preliminary analysis. IBM has published a detailed technote on Java core files and their analysis.
It is a good idea for any Support engineer to read this article, perferably with an actual core file to refer. However, the current article is simply to present you with an IBM tool, IBM Thread and Monitor Dump Analyzer for Java. The home page of this tool is at:
Here is the download link:
ftp://public.dhe.ibm.com/software/websphere/appserv/support/tools/jca/jca457.jar
About the technology
Jinwoo Hwang (http://JinwooHwang.com/) is a software engineer, inventor, author and previous technical leader within the IBM WebSphere Application Server Technical Support team, which is based in Research Triangle Park, N.C. He joined IBM in 1995 and worked with IBM Global Learning Services, IBM Consulting Services, support and development teams.
Since Mr. Hwang's departure from IBM, the IBM HeapAnalyzer is now maintained by the WebSphere Application Server Level 2 Support SDK team. The current developer is Thomas Ireton, any questions and concerns should be routed to Thomas at tireton@us.ibm.com
Running the Tool
Download the jar file anywhere you like. From that directory, run it as follows:
<Java Runtime Environment path>java -Xmx500m -jar jcaNNN.jar
Note: NNN is the version number.
Note: Of course, you must have a Java SDK, not simply a JRE – the JRE does not contain the functionality to run a Java jar file.
You will be presented with the splash screen:

Figure 1
Go to the File menu, Open Thread Dumps and navigate to a Java core file you want to analyze.
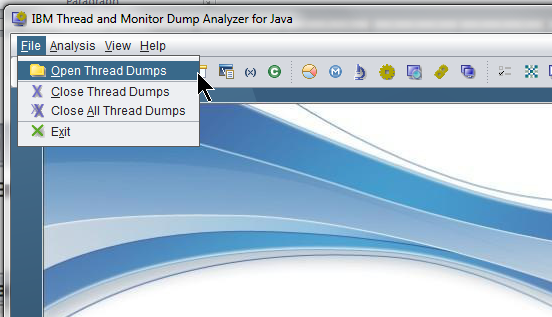
Figure 2
After the file has been loaded, be patient while the tool performs the analysis. After a short time, you will see:
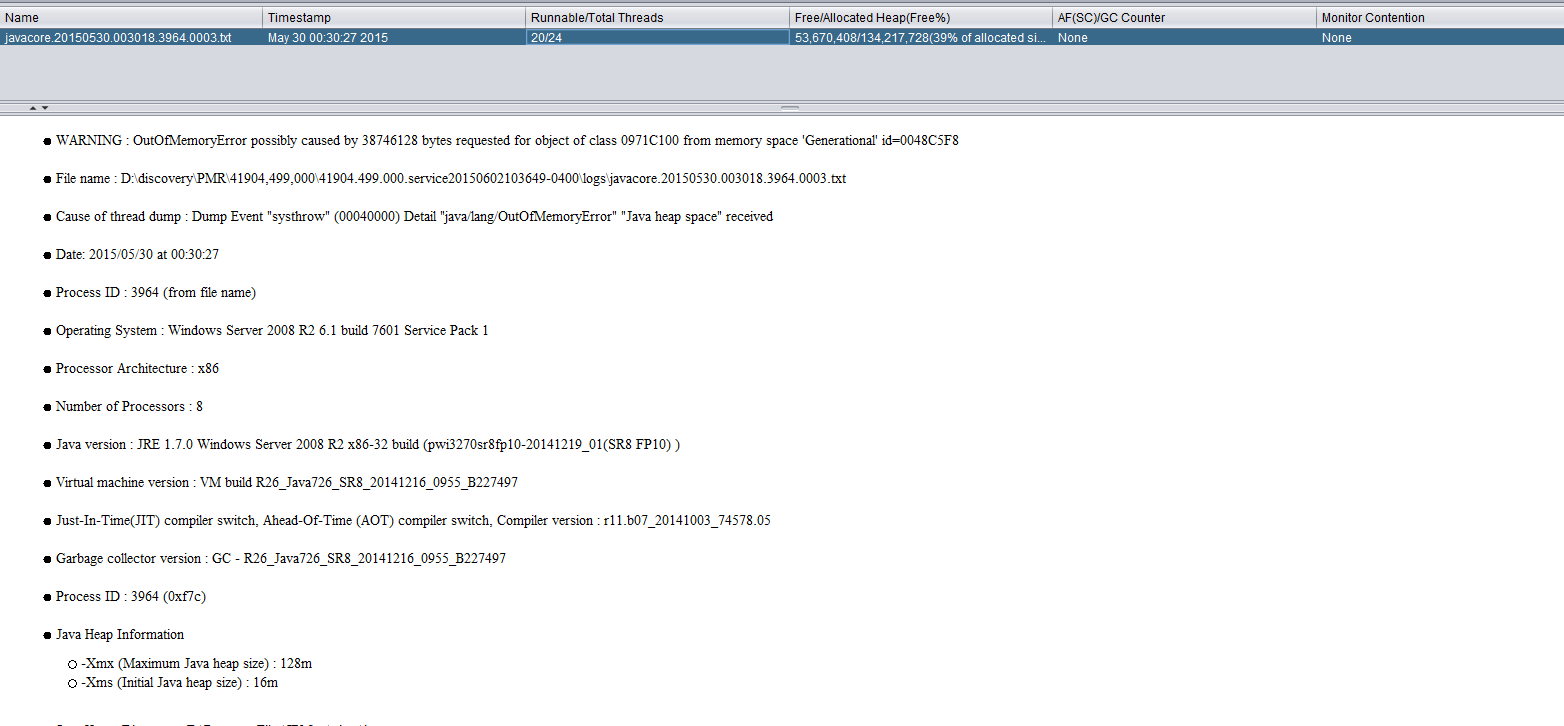
Figure 3
It should be immediately apparent that there is a wealth of debugging details that you can use, including JRE version and the operating system. More importantly, however, is that you know the process ID of the JVM that crashed, but even more important is that the Anlayzer tells you the cause:
- Cause of thread dump: Dump Event "systhrow" (00040000) Detail "java/lang/OutOfMemoryError" "Java heap space" received
This tells us, among other things, that the Java heap is what was compromised. Combined with the first analysis:
- WARNING: OutOfMemoryError possibly caused by 38746128 bytes requested for object of class 0971C100 from memory space 'Generational' id=0048C5F
This will help us pinpoint the moment when the heap was compromised.
If we scroll down, we see that this JVM is configured with a very small heap:
- Java Heap Information
- -Xmx (Maximum Java heap size) : 128m
- -Xms (Initial Java heap size) : 16m
It is unlikely that this heap could withstand much work. One quick fix would be to increase the Maximum Java heap size for this JVM.
Additional information can be found in the Command-Line Arguments and Environment Variable Analysis sections.
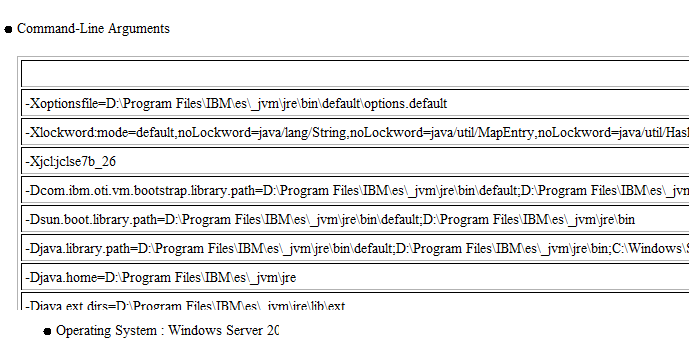
Figure 4
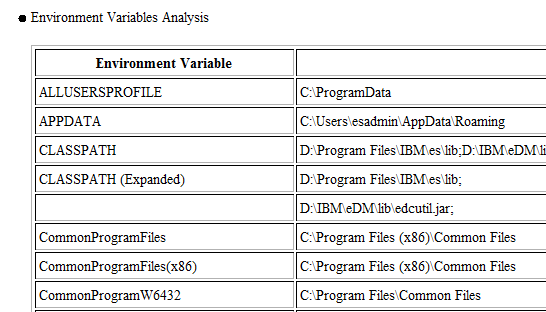
Figure 5
Support will be able to determine a lot from the current thread analysis -- the thread that was running when the crash occurred:

Figure 6
In Content Analytics terms, this would likely pertain to the crawling/parsing process, which reads in raw byte data and then pushes it to the parser.
The Garbage Collection history refers us back to the original cause of the core being thrown:
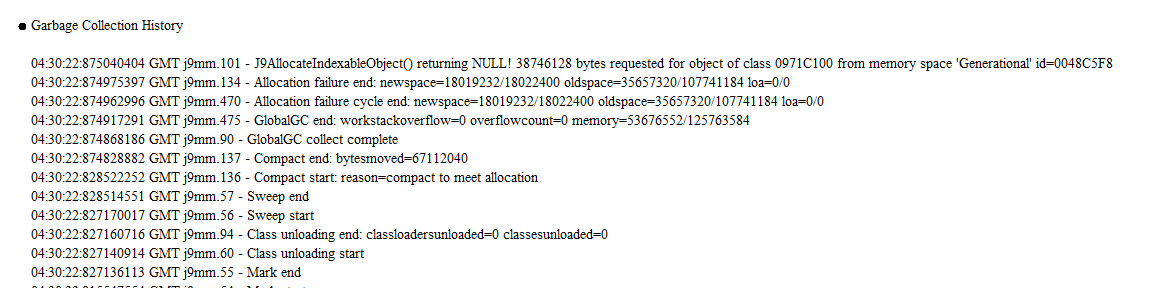
Figure 7
There was simply no more memory to allocate for the request.
View the same information in a User Interface
All of the above information can be viewed graphically, using either the Analysis menu:
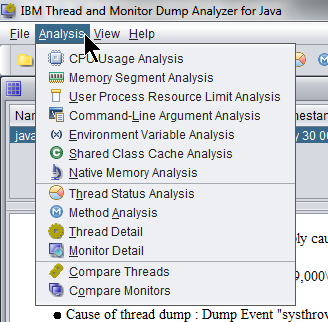
Figure 8
Or the icon tray:
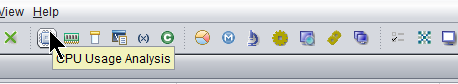
Figure 9
Often people confuse memory errors with CPU usage. If we look at the graphical CPU usage chart, it is obvious that this crash had nothing to do with the CPU, which was virtually unused.

Figure 10
We should definitely take a look at Thread Analysis since it is a major feature of the tool. Of course, this type of analysis requires a great deal of knowledge. Start by opening the Thread Status Analysis UI.

Figure 11
In this case we might assume that the JVM is getting hung – half the threads are waiting on some condition.

Figure 12
Almost all of the rest of the threads are parked.

A complete explanation of all thread states for Java 7 can be found here:
There is one last view we will look at in this article. It gives a look at the ulimits on a Unix system.

Figure 13

Figure 14
It is frequently the case when running Content Analytics on a Unix system, that the ulimit is reached or exceeded, with reference to the number of files that can be simultaneously opened. This is indicated by the NOFILE argument in Figure 12, above, with hard and soft limits.
----------
Author : Kameron A Cole
Job Title: Watson Level 2 Support Engineer
Email: kameroncole@us.ibm.com
Bio: Kameron Cole is an unstructured information solutions architect. He was a WebSphere consultant for many years, but has become an expert in IBM search technology over the past 10 years, in his role as Complex Solution Architect for the Content Analytics Platform
Company: IBM Watson
UID
ibm11281046