Technical Blog Post
Abstract
Building FileNet usage reports with cognos Part 3
Body
In the last entry we put every dimension together and created the datasource to the FileNet database. Now we will create the framework manager project and create the relationships within the model to be able to create our reports.
Creating the Cognos Framework Manager Project
Because our database was not designed for modeling, we use Cognos Framework Manager in order to change the Model Structure to make it more understandable for the business users that are going to make the reports and to make it more suitable for our needs.
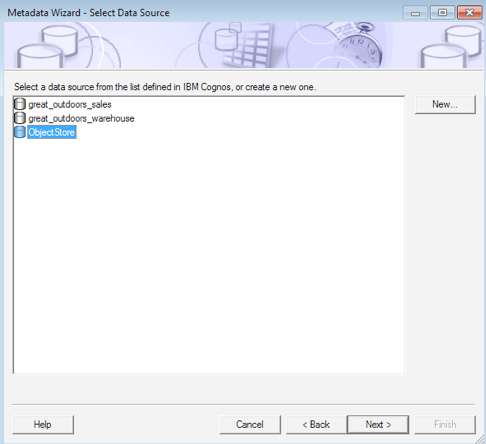
Start Cognos Framework Manager and create your first project, put a name to it a move to the next step. In the new windows select metadata wizard and select our recently created data source.
Figure 31. Creating the project Part 1
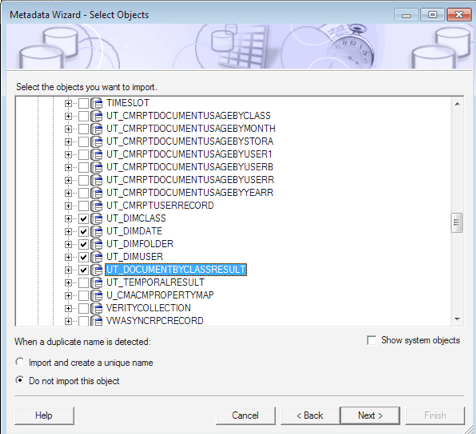
Select the four dimensions and the fact table and on the next step click on the import button.
Figure 32. Creating the project Part 2
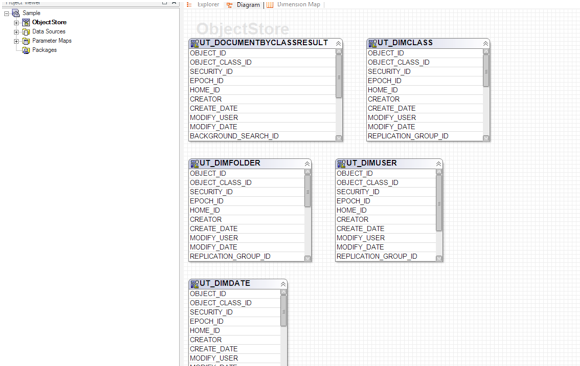
Click on the diagram tab and you will see all our tables with their columns, before creating the dimension and the fact table we need to create the relation between the tables.
Figure 33. Modify the model structure
Our model as-is doesn’t have relationships and I prefer to avoid the modification of the database structure, that’s why we are going to create relationships just for reporting purposes. To create a relationship click on the last icon of the toolbar, click on DIMCLASS table and drag it to the DOCUMENTBYCLASSRESULT table (it doesn’t matter if you end up with another property highlighted)
Figure 34. Create the relationship Part 1
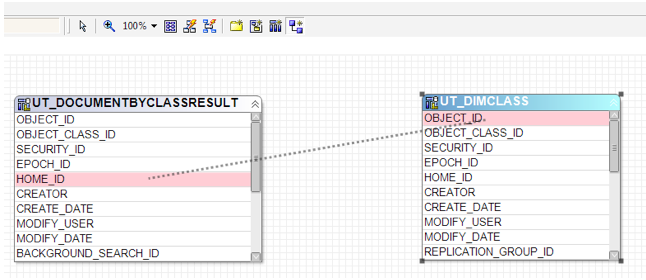
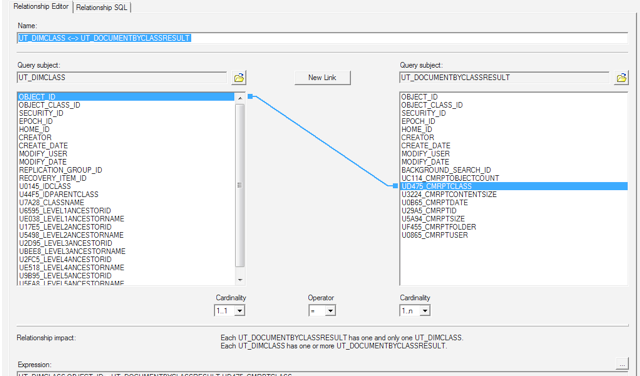
Link the CMRPTCLASS from the Fact to the OBJECT_ID of the dimension
Figure 35. Create the relationship Part 2
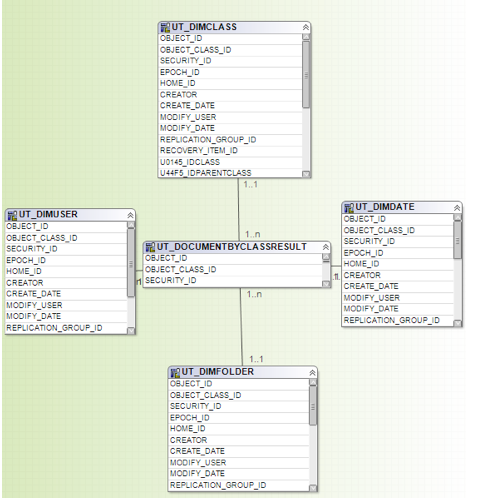
Then link the rest of your dimensions to get the following result
Figure 36. Model Complete
Our model is complete but haven’t reached its full potential yet. We need to create the dimensions and fact objects in order to reach our goal.
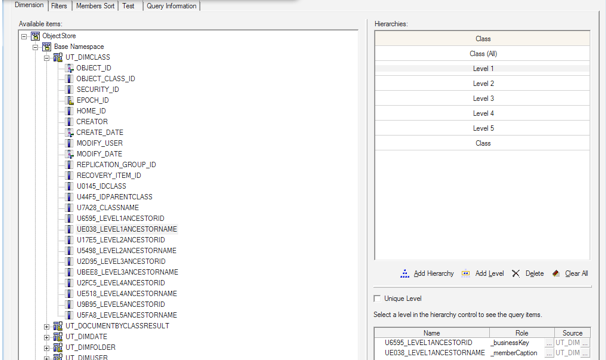
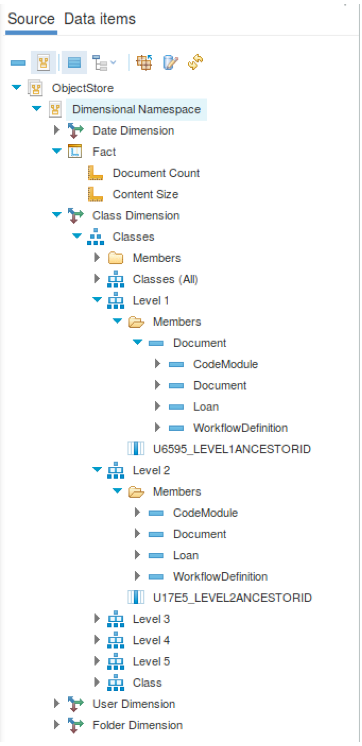
Right click anywhere on the model, select create and choose dimension. On this new windows click the Add Hierarchy button and add 6 levels to it; then, on the left side expand the dimension class node and drag the level 1 ancestor name to the hierarchy level 1. You will be prompted to select between three roles, for the ids select business key and for the names select member caption. Repeat these steps with the other levels.
Figure 37. Cognos Class Dimension Hierarchy
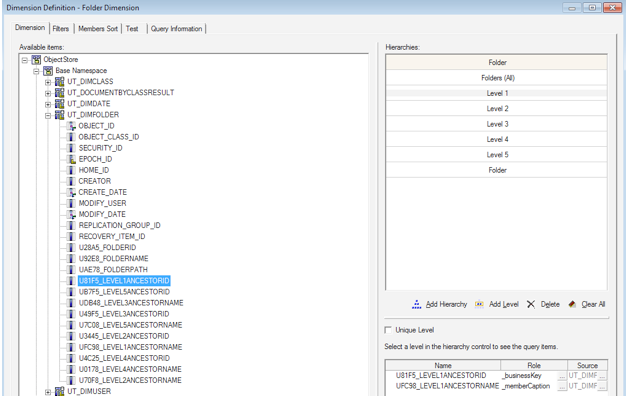
For the folder dimension you can follow the same steps as the class dimension.
Figure 38. Cognos Folder Dimension Hierarchy
You can download the full project from this article to check the configuration of the user and date dimensions.
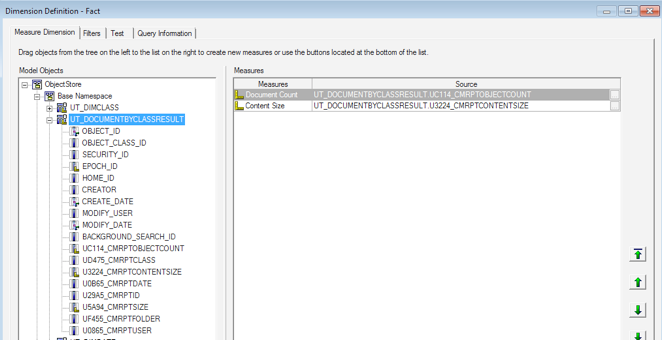
With the dimensions done its time to create the fact table, right click anywhere on the model, select create and choose fact. From the new window left pane drag the object count property and content size property, you can rename them to make it more understandable.
Figure 39. Cognos Fact Table
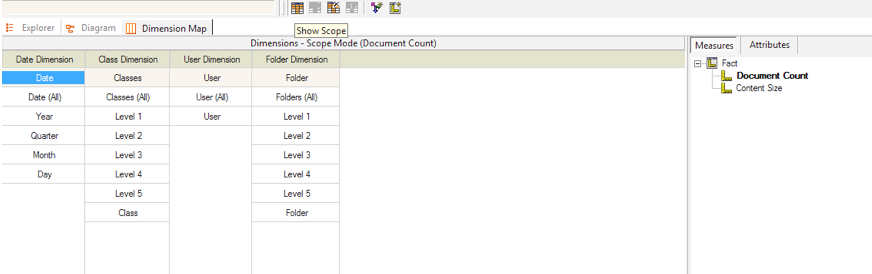
Go to the Dimension Map, now the we have our hierarchies and metrics we need to put the dimensions in scope of the measures in order to define the level at which our measures will be available in the report.
Click on the show scope icon.
Figure 40. Scope Definition Part 1
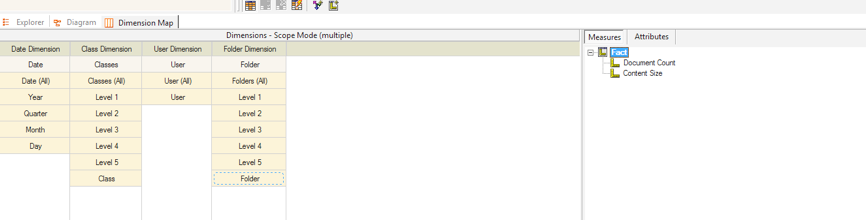
Then on the last level of each hierarchy click set scope, you will notice it worked because it will highlight the levels in scope.
Figure 41. Scope Definition Part 2
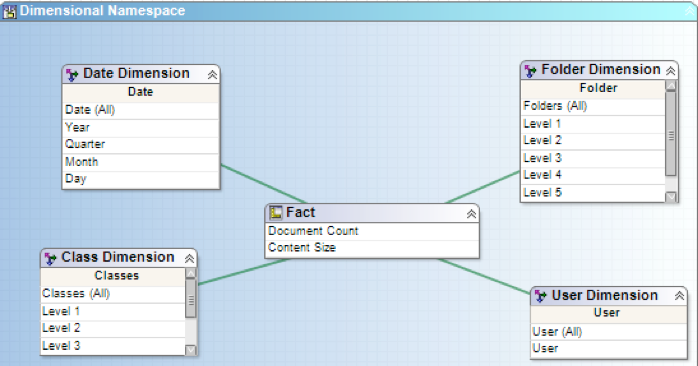
And as result we have our reporting model complete!
Figure 42. Model Complete
On the project viewer pane, right click packages, select create and then package. Name your package and select only the dimension and Fact from the figure 37 and click Finish. Click yes on the next window to start the package publishing wizard, select the location of the package, move to the last window and click finish.
Create the Report in Cognos Analytics
To finish this article ill show you an example of what you can do using our model
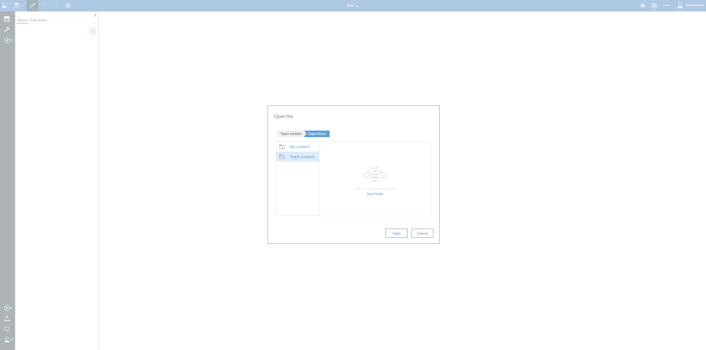
To create a report login into Cognos Analytics click new on the left pane and select report. Select any template you want, then click data on the left pane, add a source to the report and select our package.
Figure 43. Source Selection
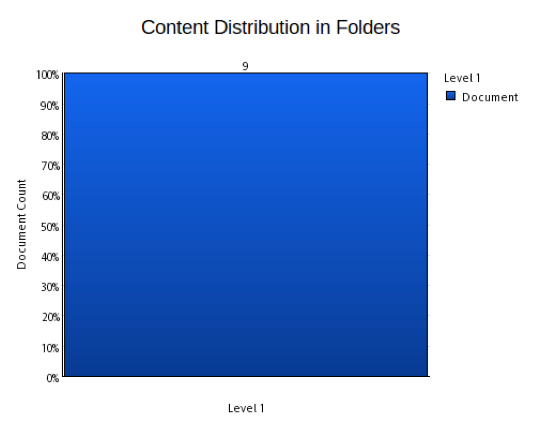
With the hierarchy you can drill down through the data, look at the following example:
On figure 38 you notice a graphic, this is build using the level 1 from class hierarchy, level 1 from folder hierarchy and document count measure.
Figure 44. Documents under the Root Folder
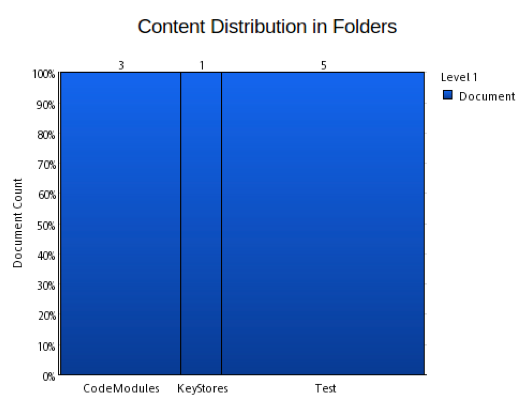
if you double click the level 1 folder hierarchy you will get folders on the level 2
Figure 45. Documents under second level folders
if you click the level 1 class hierarchy you will get classes on the level 2
Figure 46. second level documents under second level folders
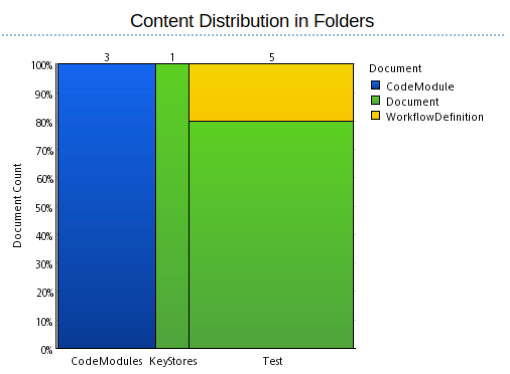
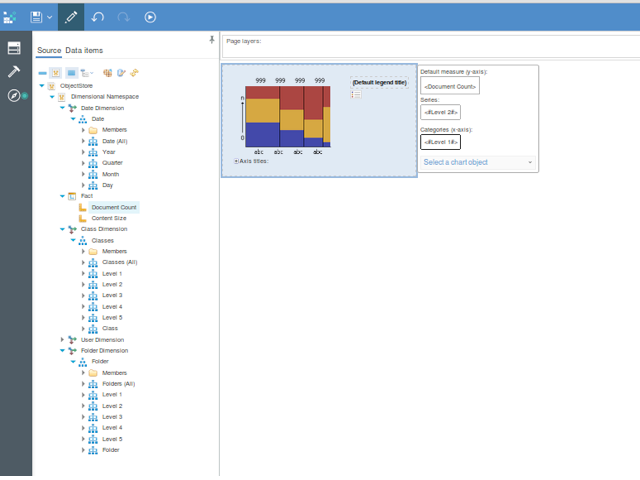
To create this click toolbox on the left pane, on the pinned section drag chart. Click on the Advanced Section and select the Marimekko chart.
Click data on the left panel and you will see the content of our package, these are the items we can to drag on the chart.
Figure 47. Package Content
From the left pane drag document count to the first field, level 1 from folder dimension to categories and level 1 from class dimension to series, since we already have a level 1 item on the query, this will be renamed to level 2.
Figure 48. Creating a chart
if you execute the report you’ll get something similar to figure 39.
You can change the graphics and structure them to build your own report.
Figure 49. Simple report example

Resources
UID
ibm11280902