Technical Blog Post
Abstract
Omnibus WebGUI - The what, when, where and how of Java heap dumps
Body
Welcome
A fine afternoon to you, the Developer Works reader, I'm James Grafton a developer on the Omnibus Web GUI team and I'm here today to blog to you about Java Heap Dumps!
Java heap huh?
A Java heap dump is a snapshot of the entire memory structure of your Java program at a specific point in time.
Sounds useful, how do I get one?
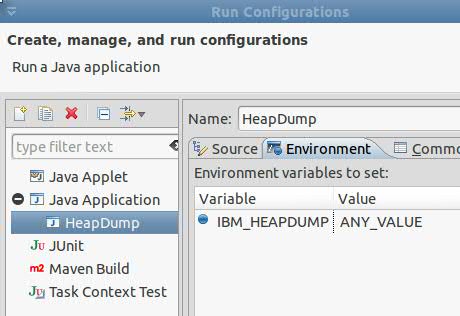
As long as you're using an IBM based JDK there is a rather handy guide here. Essentially it's just a case of setting an environmental variable at launch, then, at some later point, sending the running JVM a specific signal indicating that you'd like to generate a heap dump - simples huh?
Fantasmagorical! Now, to make the most of it...
Hot off the press! A graphical heap analyser able to run across platforms, suggest likely memory leaks, performance faux pars - a most useful tool indeed! But wait, even better, it comes with a full overview tutorial well worth the download then!
And here's one I made earlier...
Based on the above, an example was produced representing end to end production and analysis of a simplistic memory leak scenario - hopefully it should help clarify everything.
Tools used:
- Eclipse Indigo
- IBM Heap Analyser 4.1.4
- IBM Java 1.6.0
1. Step one
Create a new Java project in Eclipse, adding a single main class named HeapDump.java with the following code:
public class Heapdump { @Override protected void finalize() throws Throwable { while (true) { Thread.yield(); } } /** * @param args */ public static void main(String[] args) { while (true) { for (int i = 0;i > 100000; i++) { Heapdump hd = new Heapdump(); } System.out.println("" + Runtime.getRuntime().freeMemory() + " bytes free!"); } } } This is an example of one of the only conditions in Java where it's possible to create a true memory leak - disrupting the garbage collector during the finalize() call.
2. Step two
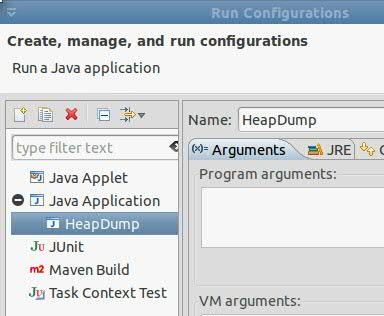
Create a run time configuration as detailed in the Alpha Works article:
3. Step three
Watch the program spectacularly fail!
4. Step four
Start HeapAnalyser, via [java -Xmx1000m jar ha414.jar <path to heapdump.phd>] and wait a few minutes for it to load the heap dump in.
5. Step five
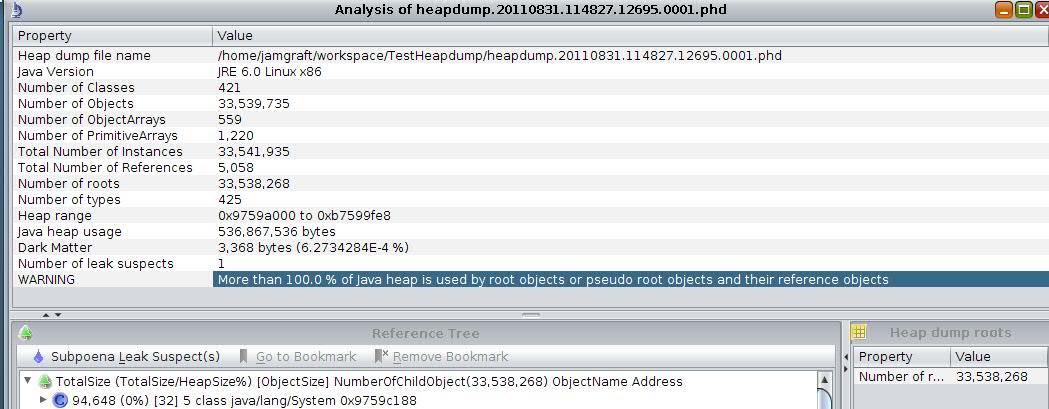
Observe the correctly identified diagnostic error:
A whistle-stop tour of Java heap dumps and their associated analysis, hopefully enough insight here to help identify their potential value.
Always interested to hear any questions on the topic - feel free to give me a shout whenever.
-James Grafton
[{"Business Unit":{"code":"BU053","label":"Cloud & Data Platform"},"Product":{"code":"","label":""},"Component":"","Platform":[{"code":"","label":""}],"Version":"","Edition":"","Line of Business":{"code":"","label":""}}]
UID
ibm11081965


