Technical Blog Post
Abstract
How to diagnose ObjectServer performance log files using UNIX filtering functions and spreadsheets
Body
The ObjectServer writes performance information to log files. These logs can give information the time spent running SQL queries, identify which clients are using excessive resources and show CPU usage of individual triggers. In my experience it's often useful to get a high level picture before diving into details. One way of encouraging yourself to look at the overview before delving into details is to generate a graph of key performance indicators over time and focus on areas of interest highlighted by the graph. In this blog I will describe a 'quick and dirty' way generating graphs by using the UNIX 'grep' and 'awk' shell commands to filter log files, turning the resultant output into a CSV file and loading it into a spreadsheet.
I deliberately coded a trigger to increase in CPU as the row count increases and use this to show how log files can be used to pin-point the cause of the failure.
I start off by looking at the profile log file ( $NCHOME/omnibus/log/<servername>_profiler_report.log<n> ) to see if any client applications are generating excessive work. The profiler log summarizes the results for all clients in each period with a log entry like the following:
Wed Jun 20 10:41:52 2012: Total time in the report period (59.978903s): 0.000000sFirst I filter for this specific message using grep.
grep "Total time in the report period" NCOMS_profiler_report.log1
  Sun Oct 07 15:17:19 2012: Total time in the report period (59.992672s): 0.000000s
  Sun Oct 07 15:18:19 2012: Total time in the report period (60.016949s): 0.000000s
Then I filter the results with an AWK script which separates out the time and date, total time for report period and CPU time in period and outputs them in CSV format. ( I also remove brackets and 's' from the numbers to avoid confusing the spreadsheet).
Here is a sample script, and command line to execute it.
Here is a sample script, and command line to execute it.
awk
  BEGIN { print "Time, report time, CPU"; }
  {
          a = $5
          gsub(/:/,"",a)
          b = $12
          gsub(/[()s:]/,"",b)
          c = $13
          gsub(/s/,"",c)
          print $1,$2,$3,$4,a,",",b,",",c
  }

  grep "Total time in the report period" NCOMS_profiler_report.log1 | awk -f profiler.awk
This gives a CSV format output.
Sun Oct 07 15:23:19 2012 , 60.009341 , 0.000000 Sun Oct 07 15:24:19 2012 , 59.994461 , 0.000000 I put that into a spreadsheet and graph the data. It doesn't show a high client CPU usage, so the next step is to look at the trigger logs. The trigger statistics are written to ( $NCHOME/omnibus/log/<servername>_trigger_stats.log<n> ).
First of all, I am interested in the following message (which gives the sum time for all triggers within the profiling period).
The format of the trigger statistics log is similar to the profiler logs. The awk script needs only a few modifications to format the trigger stats into a CSV file (the column offset for 'b' and 'c' has increased by 1). I filter using grep and the awk script below.
I load the output into a spreadsheet and graph CPU over time. This is a bit more interesting. It shows the total CPU time for each report period.
Wed Jun 20 10:56:52 2012: Time for all triggers in report period (60s): 0.147708sThe format of the trigger statistics log is similar to the profiler logs. The awk script needs only a few modifications to format the trigger stats into a CSV file (the column offset for 'b' and 'c' has increased by 1). I filter using grep and the awk script below.
awk
  BEGIN { print "Time, CPU"; }
  {
          a = $5
          gsub(/:/,"",a)
          b = $13
          gsub(/[()s:]/,"",b)
          c = $14
          gsub(/s/,"",c)
          print $1,$2,$3,$4,a,",",b,",",c
  }
I load the output into a spreadsheet and graph CPU over time. This is a bit more interesting. It shows the total CPU time for each report period.
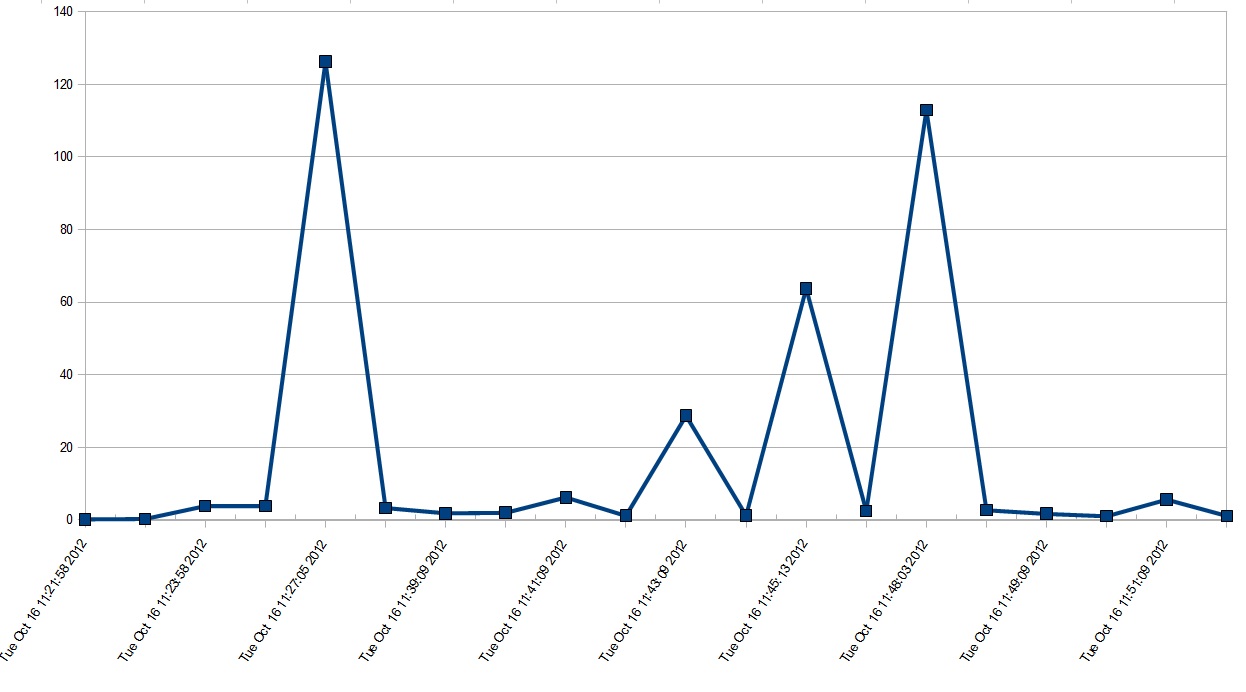
The graph shows a regular spike in CPU usage, which implies a temporal trigger. It narrows down the times we are interested into a number of specific periods. I can now focus on these specific times to try and isolate if any specific triggers are using excessive CPU at these times.
Sure enough, in each period a trigger called 'slowtrigger' is taking most of the CPU.
We still need to diagnose the reasons for the trigger running slowly. However we have made our job much easier by narrowing down the likely piece of code causing the problem.
Sure enough, in each period a trigger called 'slowtrigger' is taking most of the CPU.
Tue Oct 16 11:45:13 2012: Trigger time for 'slowtrigger': 63.601230sWe still need to diagnose the reasons for the trigger running slowly. However we have made our job much easier by narrowing down the likely piece of code causing the problem.
To find out more about interpreting ObjectServer performance logs and key performance indicators, see the following section on the information center.
[{"Business Unit":{"code":"BU053","label":"Cloud & Data Platform"},"Product":{"code":"","label":""},"Component":"","Platform":[{"code":"","label":""}],"Version":"","Edition":"","Line of Business":{"code":"","label":""}}]
UID
ibm11082043