Technical Blog Post
Abstract
DB2 HANG DATA COLLECTION
Body
Problem definition:
Every DBA has encountered a problem when the database is not responding and had to use the failover mechanism to bring the service back up. In this article, we will move from defining different types of hangs and what to collect to debug the problem. Scope of this document is single partitioned database hosted on Linux/Unix and Windows. This data collection is to get close to the complete data set i.e. covering recursion, latching and other symptoms but sometime support might have to ask more debug data is the problem include O.S API’s etc.
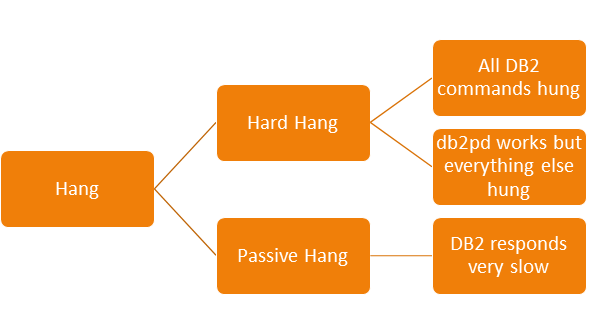
Hard hang:
When DB2 does not respond to any commands on CLP such as DB2 “list applications” does not return the prompt back. DB2 typically makes many OS level calls which requires to execute in kernel space and potentially can get stuck there for whatever reason. From DB2 user perspective, we would divide into as
- Every DB2 command related to the processing such as connect to DB, existing connection executing any select hangs. Get snapshot commands or mon report did not return the prompt back and db2pd commands are also timing out
Passive Hang:
When DB2 engine responds but at a very slow pace but OS commands are running fine without any delay. Example would be, DB2 list applications takes several minutes to return the value. vmstat/iostat and top/topas commands are showing values without any issue.
Data collection: -
In a hang state, the most essential data to debug the problem are stack traces for all the edus (Engine dispatched unit) under db2sysc process. We are covering the stack collection in 2 ways, one from DB2 infrastructure and one from O.S. The reason for both DB2 and O.S is to cover both user space information and kernel space. There are cases when the signal handler might miss the stack dump signal if it is in kernel code path.
The first and most important thing is the classification of the hang. The most common command used for data collection in such scenarios is db2fodc -hang full or db2fodc -hang basic.
db2fodc -hang full: - It collects data using db2cos infrastructure which would include stacks, traces, snapshots and O.S information. It is most suitable for the passive hang situations.
db2fodc -hang basic: - As the name suggests, it collects the subset of the information as compare to full option. Best suitable for the situations when the new connections are hanging but your existing connection is able to process the request.
Hard hang:
When every db2 command hangs on the CLP including db2pd
Assuming that the system resources are not exhausted ( such as memory ) at the time when the problem happens.
AIX:
vmstat -Iwt 1 30 > vmstat_Iwt.issue.`date '+%Y-%m-%d-%H.%M.%S'`
iostat -RDTVl 2 15 > iostat_RDTVl.issue.`date '+%Y-%m-%d-%H.%M.%S'`
ps -kelf >ps.kelf.`date '+%Y-%m-%d-%H.%M.%S'`
svmon -P `db2pd -edus | grep "^db2sysc" | awk '{ print $3 }'` > svmon.P.`date '+%Y-%m-%d-%H.%M.%S'`
svmon -G >svmon.G.`date '+%Y-%m-%d-%H.%M.%S'`
Get db2sysc process id using ps -ef |grep db2sysc
ps -mo THREAD -p <db2sysc pid> >db2sysc.thread.`date '+%Y-%m-%d-%H.%M.%S'`
procstack <db2sysc pid> >pstack.`date '+%Y-%m-%d-%H.%M.%S'`
Wait for 30 second
procstack <db2sysc pid> >pstack.`date '+%Y-%m-%d-%H.%M.%S'`
Wait for 30 second
procstack <db2sysc pid> >pstack.`date '+%Y-%m-%d-%H.%M.%S'`
AS root:
Download the tool pdump.sh from https://www.ibm.com/support/pages/node/6117190 and then run it as
pdump.sh –l <db2sysc pid>
sleep 60
pdump.sh –l <db2sysc pid>
Note: Sometimes if db2sysc has lot of threads, it can take some time to dump, so please be patient
If the above is not working, then get stacks of ALL the threads using the following commands:
echo 'th *' | kdb -script >thread.list
egrep -v "NONE|ZOMB" thread.list | egrep pvthr | tr '*!>' ' ' | awk '{print "f "$2}' | kdb -script > thread.stacks.`date '+%Y-%m-%d-%H.%M.%S'`
Wait for 30 seconds
echo 'th *' | kdb -script >thread.list
egrep -v "NONE|ZOMB" thread.list | egrep pvthr | tr '*!>' ' ' | awk '{print "f "$2}' | kdb -script > thread.stacks.`date '+%Y-%m-%d-%H.%M.%S'`
Linux:
vmstat 1 30 > vmstat.issue.`date '+%Y-%m-%d-%H.%M.%S'`
iostat -xt 2 15 > iostat_xt.issue.`date '+%Y-%m-%d-%H.%M.%S'`
ps -eLf >ps_eLf.`date '+%Y-%m-%d-%H.%M.%S'`
top -b -n 2 -d 10 >top.`date '+%Y-%m-%d-%H.%M.%S'`
Get db2sysc process id using ps -ef |grep db2sysc
gstack should be installed on the machine.
As DB2 instance owner OR root
gstack <db2sysc pid> >gstack.`date '+%Y-%m-%d-%H.%M.%S'`
Wait for 30 second
gstack <db2sysc pid> >gstack.`date '+%Y-%m-%d-%H.%M.%S'`
Wait for 30 second
gstack <db2sysc pid> >gstack.`date '+%Y-%m-%d-%H.%M.%S'`
The above prints the user side stack of the threads.
To get the kernel side of the stacks, as user root, issue the following commands:
echo “1” > /proc/sys/kernel/sysrq
echo “t” > /proc/sysrq-trigger ( This will dump the stacks of all threads )
dmesg > kernel.stack.`date '+%Y-%m-%d-%H.%M.%S'`
Wait for 30 second
echo “1” > /proc/sys/kernel/sysrq
echo “t” > /proc/sysrq-trigger ( This will dump the stacks of all threads )
dmesg > kernel.stack.`date '+%Y-%m-%d-%H.%M.%S'`
echo “0” > /proc/sys/kernel/sysrq
Windows:
db2bddbg -d db2ntDumpTid <path> -1 stack.1
Wait for 30 second
db2bddbg -d db2ntDumpTid <path> -1 stack.2
Once it is done try to format the stacks using
db2xprt stack.1 stack.fmt.1
db2xprt stack.2 stack.fmt.2
When DB2 commands hang but db2pd is responding.
AIX:
OS commands:
vmstat -Iwt 1 30 > vmstat_Iwt.issue.`date '+%Y-%m-%d-%H.%M.%S'`
iostat -RDTVl 2 15 > iostat_RDTVl.issue.`date '+%Y-%m-%d-%H.%M.%S'`
ps -kelf >ps.kelf.`date '+%Y-%m-%d-%H.%M.%S'`
svmon -P `db2pd -edus | grep "^db2sysc" | awk '{ print $3 }'` > svmon.P.`date '+%Y-%m-%d-%H.%M.%S'`
svmon -G >svmon.G.`date '+%Y-%m-%d-%H.%M.%S'`
DB2 commands:
db2pd -alldbs -mempool -memset -dbptnmem –inst >db2pd.mempool.`date '+%Y-%m-%d-%H.%M.%S'`
db2pd -alldbs –active -apinfo -agent >db2pd_age.`date '+%Y-%m-%d-%H.%M.%S'`
db2pd -edus -rep 30 3 >db2pd.edus.`date '+%Y-%m-%d-%H.%M.%S'`
db2pd -stack all dumpdir=`pwd` -rep 30 3>stack.`date '+%Y-%m-%d-%H.%M.%S'`
Linux:
vmstat 1 30 > vmstat.issue.`date '+%Y-%m-%d-%H.%M.%S'`
iostat -xt 2 15 > iostat_xt.issue.`date '+%Y-%m-%d-%H.%M.%S'`
ps -eLf >ps_eLf.`date '+%Y-%m-%d-%H.%M.%S'`
top -b -n 2 -d 10 >top.`date '+%Y-%m-%d-%H.%M.%S'`
cat /proc/meminfo > meminfo.txt.`date '+%Y-%m-%d-%H.%M.%S'`
mpstat -P ALL 1 15 > mpstat.txt. .`date '+%Y-%m-%d-%H.%M.%S'`
pidstat -t -u -T TASK 1 15 > pidstat.txt. .`date '+%Y-%m-%d-%H.%M.%S'`
pidstat -r 1 15 > pidstat_mem.txt. .`date '+%Y-%m-%d-%H.%M.%S'`
pidstat -d 1 15 > pidstat_disk.txt. .`date '+%Y-%m-%d-%H.%M.%S'`
DB2 commands:
db2pd -alldbs -mempool -memset -dbptnmem –inst >db2pd.mempool.`date '+%Y-%m-%d-%H.%M.%S'`
db2pd -alldbs –active -apinfo -agent >db2pd_age.`date '+%Y-%m-%d-%H.%M.%S'`
db2pd -edus -rep 30 3 >db2pd.edus.`date '+%Y-%m-%d-%H.%M.%S'`
db2pd -stack all dumpdir=`pwd` -rep 30 3>stack.`date '+%Y-%m-%d-%H.%M.%S'`
Windows:
DB2/OS commands:
db2pd -winx >winx.out
db2pd -vmstat 1 10>vmstat.out
db2pd -alldbs -mempool -memset -dbptnmem >db2pd.mempool
db2pd -alldbs –active -apinfo -agent >db2pd_age
db2pd -edus -rep 30 3 >db2pd.edus
db2pd -stack all dumpdir=`pwd` -rep 30 3>stack.out
Stacks will be dumped in the current directory. Format them using db2xprt <stack.bin> >stack.fmt.1
Trace command are the same on all 3 platforms:
db2trc on -l 512m -t
Wait for 1 minute
db2trc dump trace.dmp.`date '+%Y-%m-%d-%H.%M.%S'`
db2trc flw trace.dmp trace.flw.`date '+%Y-%m-%d-%H.%M.%S'` -t
db2trc fmt trace.dmp trace.fmt.`date '+%Y-%m-%d-%H.%M.%S'`
In Windows name it as trace.flw.1 and so on.
[{"Business Unit":{"code":"BU058","label":"IBM Infrastructure w\/TPS"},"Product":{"code":"SSEPGG","label":"Db2 for Linux, UNIX and Windows"},"Component":"","Platform":[{"code":"PF025","label":"Platform Independent"}],"Version":"","Edition":"","Line of Business":{"code":"LOB10","label":"Data and AI"}}]
UID
ibm13286725