Using Tealeaf and Digital Analytics Part 1 - Segmentation
Technical Blog Post
Abstract
Using Tealeaf and Digital Analytics Part 1 - Segmentation
Body
As a Tealeaf consultant one of the more common questions I have had is "How do I leverage my digital analytics with Tealeaf?". For me to really understand how to answer that question we first need to understand the strengths of each tool. Luckily, before I began consulting at Tealeaf, I spent 7 years working with digital analytics. And, what really attracted me to Tealeaf is what digital analytics was missing-- being able to deep-dive into the data to really understand WHY something was happening. But, to get into all the strengths of each tool would make for a long post, so, this will be the first in the series of digital analytics and tealeaf strengths, and how to leverage them together.
One of the more powerful capabilities in digital analytics is segmentation. The ability to create segments that point out troubled areas or even areas of opportunity. Creating a segment in digital analytics is easy and really this is the way to analyze website performance beyond looking at base metrics like counts, sessions, visitors, conversion, etc. A tool that I often used as a digital analyics consultant was a quadrant of sessions and conversion. Each part of the segment would then be applied to the quadrant and ranked against each other.This allowed for some quick insights and a starting point for further analysis. With Tealeaf we do have a wealth of data and sessions, but it is often like finding a needle in a haystack. This is your magnet to find that needle.
Coal - (High Visits, Low Conversion) this is the area that Tealeaf really excels at. Finiding out why a segment is not converting as well as others. Basically, these are segments that are getting a lot of attention, but are not converting very well. Understanding the customer experience here is very valuable. Diving into an abandonment analysis on this segment may reveal bad customer experience.
Rock Stars - (High Visits, High Conversion) this segment is really what drives a lot of value for your website. Understanding the "why" may help you increase visibility or conversion to other segments.
Hidden Gems - (Low Visits, High Conversion) if you are lucky enough to find a few of these, in some cases you can drive a lot of value for your website quickly. Make this segment more visible, accessible and/or drive more traffic to it, and you will create some quick value from your analysis.
Losers - (Low Visits, Low Conversion) although these will not be the focus of your analysis, once you are finshed with some of the segments outside the losers quadrant, remove the other quadrants as outliers and redo the analysis for the losers quadrant for further edge case analysis. Often we forget that many sites experience "Death from a thousand cuts". Many edge cases can be just as important as a large finding.
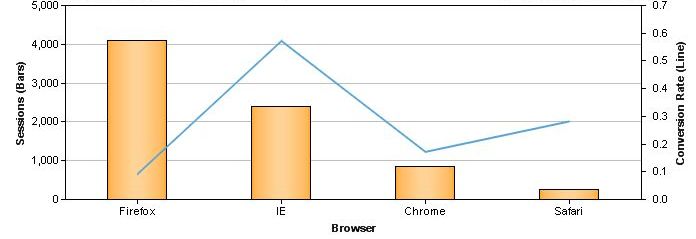
Visualizing a quadrant can be done in Tealeaf by looking at session counts related to your base conversion and adding the conversion rate as an alternative Y axis. In this Tealeaf chart we are looking at checkout starts as bars and the conversion rate as a line (right Y axis). We can quickly see that IE is the RockStar having both high session counts and high conversion. While Firefox is the Coal of the segments having High session counts, but low conversion. This is a quick and easy way to visualize the quadrants above.
By putting your data into a scatter plot you can also visualize your segments. I often draw the quadrants by the average and also by the mean to create the quadrant view. In the example above, I am looking at category landing pages and added in bubble sizes to see the average order value from each category landing page. From here it may make sense to then deep dive into the laptop landing page section and do an abandonment analysis. We learn that cameras drive a lot of value to the website, so we should understand why. And, although head phones appear to be a valuable hidden gem, perhaps car audio would be better to look into because it has a larger AOV and therefore may be a better opportunity.
So how do I leverage segmentation in digital analytics with segmentation in Tealeaf? Well, that's where we have some really interesting inegrations. In IBM Digital Analytics, as well as with other digital analytics tools like Adobe Site Catalyst, we can push segments directly into Tealeaf. So, if you find a segment that fits into the quadrant above and needs further analysis, just push the segment into Tealeaf and start doing further analysis. The ability to replay sessions and dive into a wealth of data will give further insights into why the segment is in the quadrant it is in.
So, digital analytics really excels at creating segments for further analysis, but as I have explained above, Tealeaf excels at gathering a wealth of data. Which brings me to the next part in our series -- Big Data segmentation. The ability to create segments based on a search across multiple sessions across a wealth of data. Tealeaf can find sessions that meet a new criteria you may have never thought of. This segment can then be pushed over into your digital analytics tool. Right now only IBM Digital Analytics supports receiving these segments. More on that next time.
Want to drive real value from your Tealeaf installation? Leverage the CX Optimization Blitz and other offerings from the Tealeaf Analytics Services Team.
[{"Business Unit":{"code":"BU055","label":"Cognitive Applications"},"Product":{"code":"SSPG9M","label":"IBM Digital Analytics"},"Component":"","Platform":[{"code":"PF025","label":"Platform Independent"}],"Version":"","Edition":"","Line of Business":{"code":"","label":""}}]