Technical Blog Post
Abstract
Hidden Gems – Right Here, Right Now
Body
Inspiration for this week's Hidden Gem comes from a crackin' noughties hit by Fatboy Slim, Right Here, Right Now. We're talking about real time data and how to get it into your dashboards to create insightful reports. There are a number of dashboards that Digital Analytics provides out of the box, but I haven't come across a customer yet that didn't want to customize these for their own business. And rightly so, if you're not getting your hands dirty slicing and dicing data you're going to get left behind by the competition.
 I'm going to illustrate a few examples of what you can do using a Demo account which is based on a fictional furniture store. To start click on the Actions button beside Dashboards in the menu and then click Create New Dashboard. In here you'll have all the usual suspects for common metrics that you can use in your dashboard.
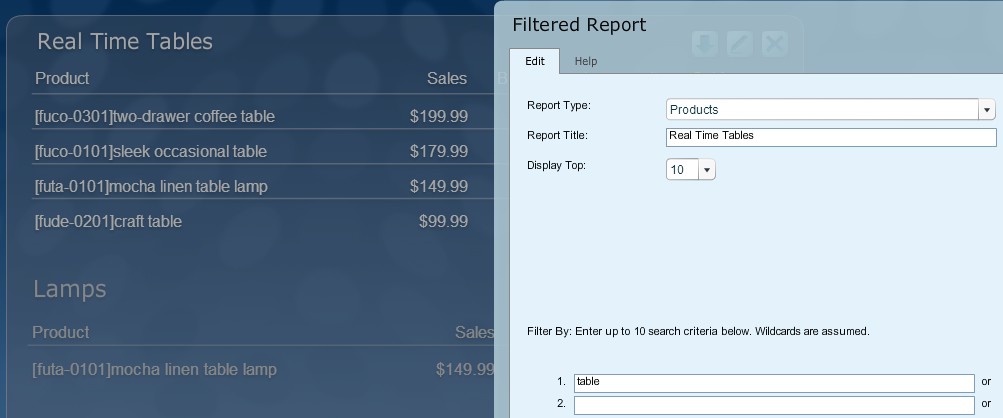
Then in the Monitor module you can start to get a bit more granular and look at what products are selling in real time and even filter these into different groups. Here we have a products report filtered for "Tables" and another one for "Lamps". You have up to 10 possible search criteria options for these which can help grouping your products together.
This is just the tip of the iceberg. The really cool stuff is in the Explore module where you can start to customize your real time reports. This option is known as Explore Live Reports and if you don't see it on your account just drop an email to the support team and they will activate it for you free of charge. Live reports are flat list reports that update data in real time.
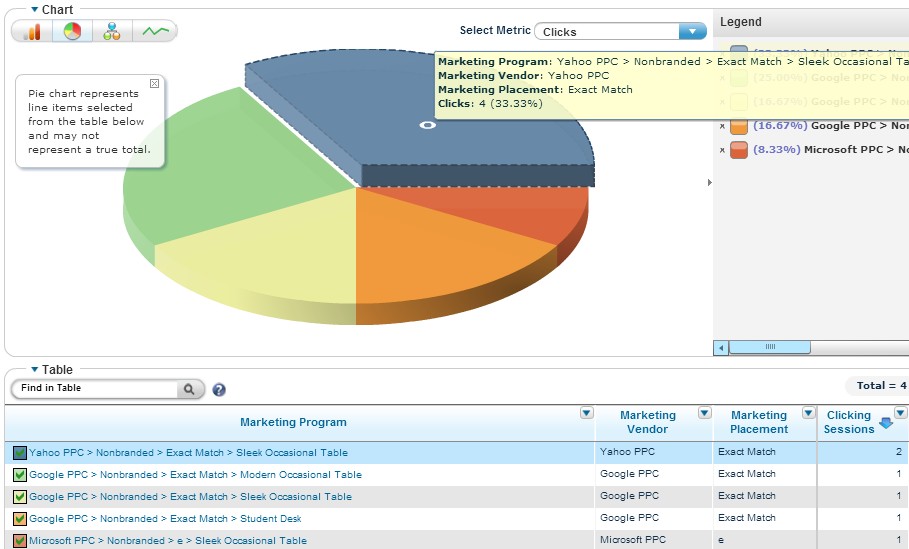
For example your marketing department might want to see what's happening with the latest PPC campaign in real time. Simply build your report in the same way that you would create your normal Explore reports. Note that you will only have a subset of metrics. Those metrics that require number crunching like sales for a marketing program are only available the next day.
So now we have our marketing programs live report but, as you can see, it's a bit messy. Let's say we want to have a separate report for PPC and another for social campaigns.
You can easily achieve this by using filters against the marketing program's name.
Go ahead and save this report. Now you have a nicely filtered view of just the PPC campaigns. You can also create Dashboard in Explore and add these real time reports by dragging and dropping your newly created report on to the dashboard designer.
Lastly, to incorporate these filtered real time reports into your Digital Analytics dashboards, simply create an Explore bookmark. This option is on the top right hand side of your report chart.
 Once the bookmark is saved you can choose a bookmarked report as the source for your dashboard in Digital Analytics.
And if you want to get into Analytics Ninja territory you can access all your analytics data in real time via the DDX (Digital Data Exchange) API. This is available to all customers, the only thing you need to do is ask the support team to turn it on for you:cm_support@us.ibm.com.
Thanks,
Aidan.
Further reading…
-IBM Digital Analytics Team
Curious about other presentations we've done?Click here and check under Connect With The Experts: Support Technical Exchange (STE) Replays
If you haven't visited the IBM Digital Analytics blog before, click here:IBM Digital Analytics Blog, then bookmark
If you're interested in getting a demo of IBM Digital Analytics click here:About IBM Digital Analytics
UID
ibm11122267


