Technical Blog Post
Abstract
Building a Custom Dashboard using Netcool/Impact
Body
I want to share with the DASH community on how we can approach building some unique custom dashboards in DASH leveraging Netcool/Impact. With the intuitiveness of DASH, combined with the simple out of box integration for Impact we can put together a custom dashboard relatively quick.
One of the challenges that we see across numerous clients is the ability to customize a list of resources. In a typical environment, a user would have a combination of Windows, Linux, and UNIX servers. Within the Tivoli Enterprise Portal we have limited capabilities to assemble a SINGLE dashboard to display KPI's and events from various operating systems. I'm talking about having a list and being able to toggle between different servers and viewing the KPI's & events while never having to navigate to a different screen.
The advantages to do so are invaluable:
1) It allows for much quicker navigation.
2) Typically switching between OS's requires a longer load time.
3) It is easier to identify issues on one screen.
Those are just three very simple reasons I can think of off the top of my head. To do this in DASH requires some basic functional knowledge of Netcool/Impact and DASH. For this blog entry, I will cover how we can bring in a mixed Managed System List of Windows and Linux machines from IBM Tivoli Monitoring and update the metrics as well.
Approach:
1) Create a connection to Netcool/Impact.
2) Create the data models in Netcool/Impact.
3) Create policy in Netcool/Impact.
4) Create Dashboard in DASH.
Here is some sample code to get us started with mashing up different operating systems from ITM using the ITM Data Provider. I’m not going to go into detail assuming that the user has some Netcool/Impact experience.
The following excerpt is written using Impact Policy Language which is JavaScript based.
systemList = {}; //declare an array to store the system list
//the GetByFilter will retrieve the list of online systems through the data model created in Impact known as “winos_msys” and “linuxos_msys”
winOnlineSystems=GetByFilter("winos_msys","AVAILABLE=1", false); LinOnlineSystems=GetByFilter("linuxos_msys","AVAILABLE=1", false);
count = 0;
while (winCount < Length(winOnlineSystems)) { //run a while loop to store all the Windows systems
System = NewObject();
System.MSN = winOnlineSystems[winCount].ORIGINNODE; //store the managed system name
System.PLATFORM = winOnlineSystems[winCount].OSPLATFORM; //store the platform
System.HOSTNAME = winOnlineSystems[winCount].HOSTNAME; //store the hostname
systemList = systemList + System; //add it to the array
winCount = winCount + 1;
}
//Run another loop to store the Linux systems.
count = 0;
while (count < Length(LinOnlineSystems)) {
System = NewObject();
System.MSN = LinOnlineSystems[count].ORIGINNODE;
System.PLATFORM = LinOnlineSystems[count].OSPLATFORM;
System.HOSTNAME = LinOnlineSystems[count].HOSTNAME;
systemList = systemList + System;
count = count + 1;
}
In my example, I mashed up the Linux and Windows system while connecting to the ITM data provider. Other customizations can include connecting to a CMDB and bringing in a list of servers that make up a specific application. Impact can connect to a variety of data sources such as databases, web services, flat files, and many others. As long as we define the output parameters through the Impact policy we can bring in the data to DASH.

(Figure 1: Array of Impact Objects & Policy Output Parameters)
Next let’s take a KPI such as CPU utilization and have that be displayed agnostic to the OS type. Here is the sample Impact Policy code:
cpuUsage = {};
//Retrieve CPU usage for specific Linux OS
count = 0;
//Here we use the GetByFilter but specific to the linux_os data model we created from Impact
cpuUsageResults=GetByFilter("linuxos_cpu","CPUID<0¶m_SourceToken="+MSN, false);
while (count < Length(cpuUsageResults)) {
Obj = NewObject();
Obj.MSN = MSN;
Obj.BUSYCPU = cpuUsageResults[count].BUSYCPU;
cpuUsage = cpuUsage + Obj;
count = count + 1;
}
//Retrieve CPU usage for specific Windows OS
count = 0;
winCpuUsageResults=GetByFilter("winos_cpu","¶m_SourceToken="+MSN, false);
while (count < Length(winCpuUsageResults)) {
Obj = NewObject();
Obj.MSN = MSN;
Obj.BUSYCPU = winCpuUsageResults[count].LOADPCT;
cpuUsage = cpuUsage + Obj;
count = count + 1;
}
Now we are able to retrieve the CPU utilization data from different OS’s in one array. Other customizations we can do include retrieving CPU’s from JVM’s, databases KPI’s, memory, and any other combination of utilization data we want to place in a dashboard.
By configuring wires and subscriptions on the dashboards we can pass in context and have the page refresh with the KPI’s. Here are some shots of the page we created for a demo at the IBM Pulse Conference.
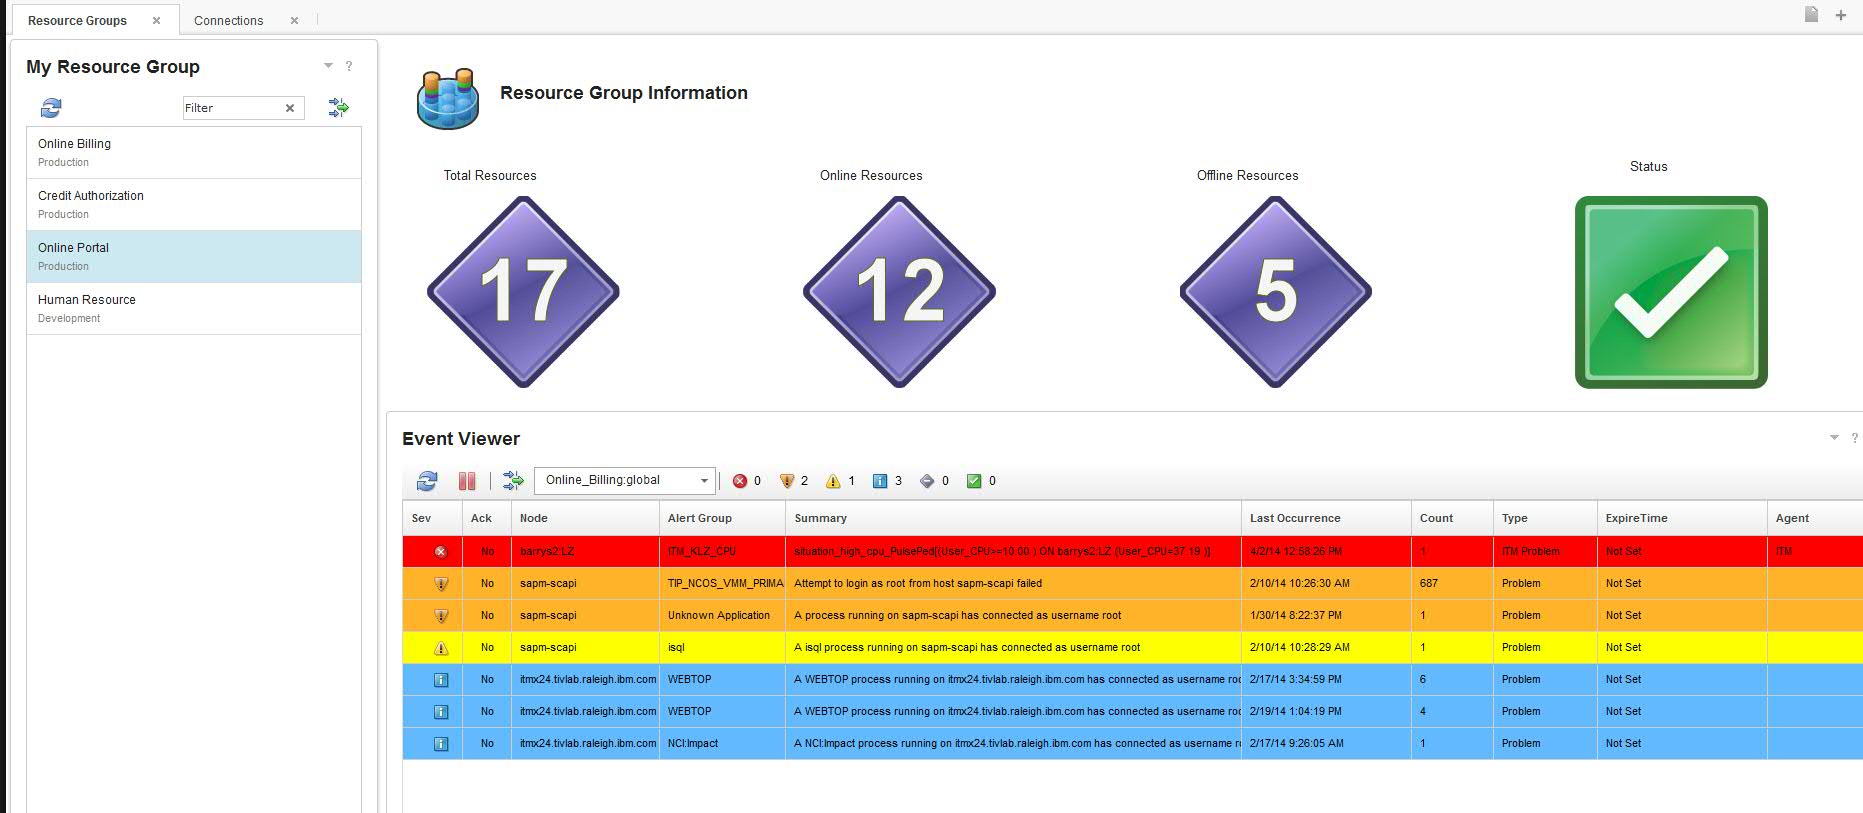
(Figure 2: Resource Groups - We can create custom groupings for applications and displays the events for the application. Clicking on the resources will launch us into figure 3.)

(Figure 3: Drilling down will display the mashed up system list that makes up the application. We can click on each individual server and retrieve the KPI's and event data from each individual system.)

(Figure 4: Selecting the event using the Omnibus Event Viewer widget, we can use a right click tool and launch in context to the OS Server Dashboard for root cause analysis of the event.)

(Figure 5: After launching the right-click tool we land on the Server OS out of box dashboard. We can see the properties and what process is causing the high CPU utilization. From here the administrator can pass this on to the server owner and kill the high cpu process or open a ticket.)
UID
ibm11275976