Technical Blog Post
Abstract
Two monitoring domains in one dashboard
Body
You can now monitor the status of your IBM Tivoli Monitoring managed systems and your IBM Performance Management SaaS managed systems in a single dashboard. These are the steps:
- Create a managed system group in the Tivoli Enterprise Portal client or with the tacmd createGroup command
- Install the Hybrid Gateway package on a Red Hat Linux system in your Tivoli Monitoring environment
- Configure the Tivoli Enterprise Portal Server connection in the Performance Management console
When you’re all done, take a look at the Application Performance Dashboard for "My Components" in the Performance Management console: 
- From the navigation bar, click Performance > Application Performance Dashboard, and select "My Components" from the navigator or by clicking the title bar of the summary box
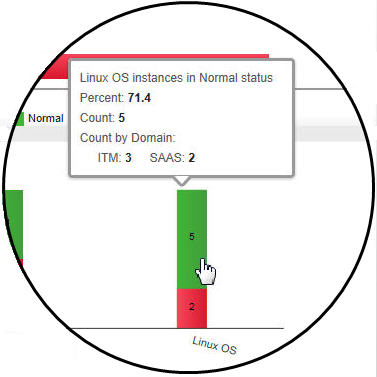
- Hover any of the stacked bar segments in the Current Components Status chart to see a count of the managed systems of that severity by domain.
- Click a stacked bar to open the status summary dashboard for all the managed systems of the same resource type. An icon in the top left corner of each group widget indicates the domain source: ITM or SaaS.

Watch the how-to video at http://youtu.be/iXmTYhy1reE and get the details at http://ibmurl.hursley.ibm.com/MX3I.
Ask me a question about using Performance Management SaaS on Twitter @MPHannah or leave a comment here. You can also read the FAQ on IBM Service Engage and ask questions on the IBM Performance Management (SaaS) forum.
[{"Business Unit":{"code":"BU053","label":"Cloud & Data Platform"},"Product":{"code":"","label":""},"Component":"","Platform":[{"code":"","label":""}],"Version":"","Edition":"","Line of Business":{"code":"","label":""}}]
UID
ibm11083369