Intrusion detection system operation
While IDS is active, it reports the suspected intrusions and extrusions that are defined by the enabled IDS policies. The production and service stacks detect these intrusions and extrusions. When an intrusion or extrusion event occurs that exceeds user-defined or default thresholds, IDS writes an intrusion monitor record to the audit journal, and optionally sends a notification to a message queue and e-mail message.
The production stack consists of the TCP/IP modules involved in most of the network operations on the IBM® i platform. The service stack consists of the TCP/IP modules involved in service and support of the IBM i platform.
The service stack comes up first and remains until the next IPL. The production stack comes up after the service stack and remains until TCP/IP is ended. After an IPL, the service stack checks to see if IDS was active before the IPL. If so, IDS is reactivated. Any intrusions and extrusions that are detected by the service stack are logged either by VLOG or Intrusion Monitor records. At this stage, IDS does not send notification to a message queue or an e-mail address. Once the policy file is available, both stacks work with IDS in the same way.
The TCP, UDP, and IP support within the stack, detect the potentially malicious situation. Even if you do not have any intrusion detection policies defined, the service stack detects certain types of intrusions, such as traffic regulation or scan events, using a set of default values. When you define a set of intrusion detection policies, the production stack starts checking for potential intrusions.
The service stack detects only IPv4 intrusions and extrusions, while the production stack detects both IPv4 and IPv6 intrusions and extrusions.
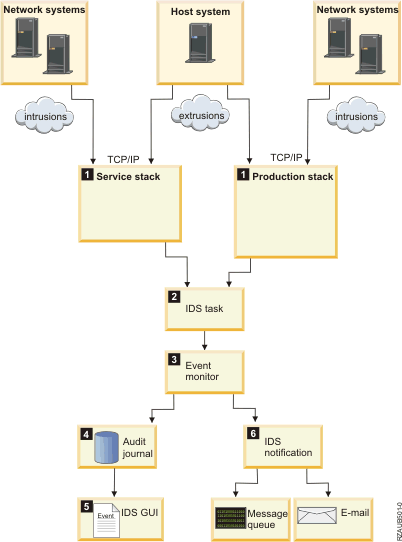
The following graphic shows how IDS detects and reports suspected intrusions and extrusions.

- When the production or service stack detects a suspected intrusion or extrusion, it sends an event to the IDS task.
- The IDS task takes each event off the queue one at a time, and matches each event with a condition (from the port table). The IDS task also keeps statistics about the intrusion and extrusion events.
- IDS signals events for intrusions and extrusions that exceed set thresholds in the policy files.
- If an event is signaled, the intrusion monitor record is created in the audit journal.
- The IDS GUI displays the intrusion events from the intrusion monitor audit records.
- If you have set up e-mail and message notification on the IDS Properties page, IDS notification sends an e-mail to the specified e-mail addresses and a message to a message queue.
You can analyze the intrusion events to determine which security actions to take. For example, you could end the interface from which the intrusion originated, or use techniques such as variable dynamic throttling to limit or prevent the intrusions from occurring.