You can use RTM to monitor and
control LSF
clusters.
About this task
Follow these steps if you are ready to monitor LSF data:
Procedure
Go to the Console > Grid Management > Clusters page.
You get information about LSF clusters
(including configured time-out thresholds, and job efficiency information) and the pollers that
collect data from them.
Click Add to add a cluster for RTM to monitor and
specify the properties of the cluster.
If you want to edit an existing cluster, click the name of the cluster that you want to
edit.
Check Collect Status in the Clusters page to view the current data
collection status for this cluster. Statuses can be Disabled,
Up, Jobs Down,
Down, Diminished, Admin
Down, and Maintenance. If you see No
data, then it indicates that there is no data collected.
After 5- 10 minutes check if the data is collected. Go to the Clusters
page and see if Collect Status is Up. If there is no
data, click on the CLog tab to check the details and fix if there is a
problem.
(Optional) If you want to change any default settings:
Go to Console > Configuration > Grid Settings to configure the LSF clusters to interact with RTM.
Go to Console > Configuration > Settings to configure RTM to interact with
LSF
clusters.
(Optional) Configure user permissions if required. You
can give permissions to other users to view graphs and other details.
Go to Console > Utilities > User Management.
After a cluster is added, all the out-of-box graphs will be initialized. After 10 minutes, you
can check these graphs under the Graphs tab in the RTM GUI. For any new
enabled graphs, you can set the time for the graph initiation. Go to Console > Grid Management > Clusters and click any cluster name Automation > Add Graph Frequency.
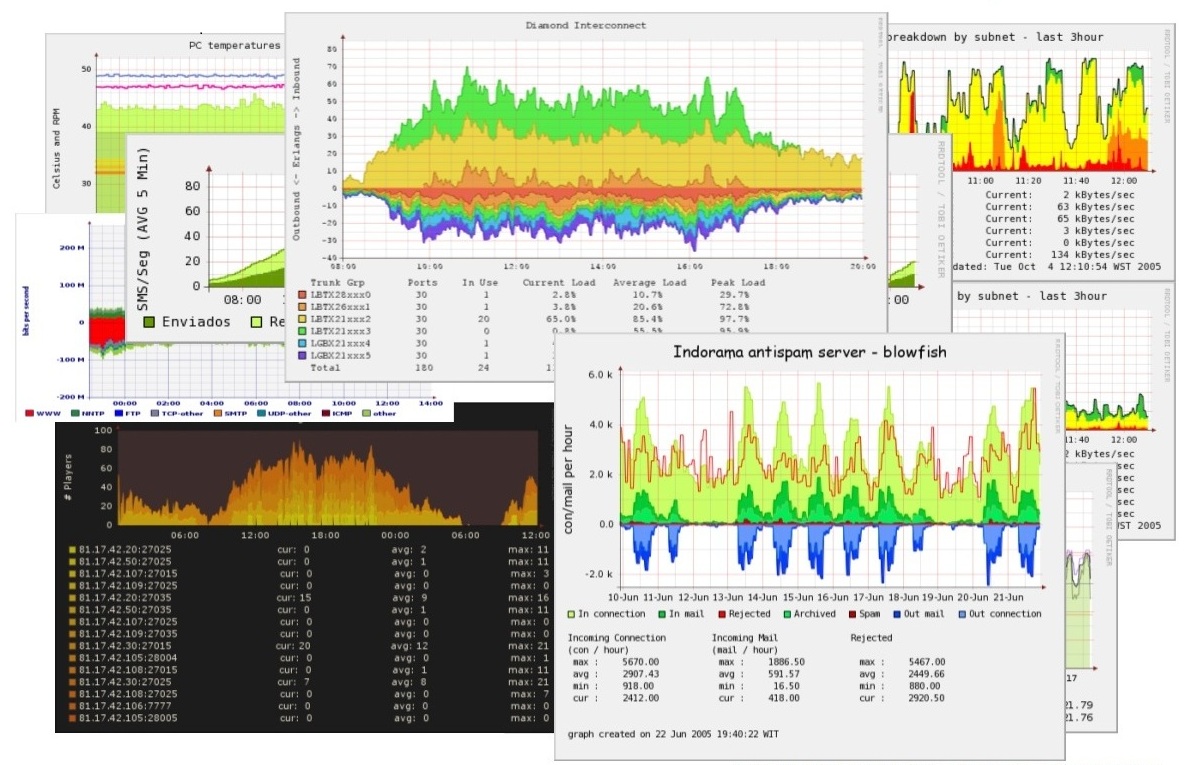
Figure 1 shows an example of various Graphs.Figure 1. RRDtool Graph Example