What's new: April 2016
New features, capabilities, and coverage became available in the April 2016 release of Performance Management on Cloud.
- IBM Performance Management on Cloud offerings are available from IBM Marketplace. Sign up for a free trial or subscription account. For more information, see Downloading your agents and data collectors.
-
- Monitoring Agent for Citrix Virtual Desktop Infrastructure
- You can use the Citrix VDI agent to monitor the health, availability, and performance of Citrix XenDesktop or XenApp resources such as sites, machines, applications, desktops, sessions, and users. This agent is in the Infrastructure Extension Pack and is available for the following offerings: IBM Monitoring, IBM Application Performance Management, and IBM Application Performance Management Advanced.
- Monitoring Agent for Skype for Business Server
- You can use the Skype for Business Server agent to monitor the health, availability, and performance of the Microsoft Lync Server resources such as database, mediation server, synthetic transactions, instant messaging, CDR service write operations, and SIP peers.
- Monitoring Agent for WebLogic
-
You can use the WebLogic agent to monitor the health, availability, and performance of WebLogic server resources such as Java™ virtual machines (JVMs), Java messaging service (JMS), and Java Database Connectivity (JDBC).
-
- Agent coexistence
- Agent coexistence is supported. You can install IBM Performance Management agents on the same computer where IBM Tivoli® Monitoring agents are installed. However, both agents cannot be installed in the same directory. See Cloud APM agent and Tivoli Monitoring agent coexistence.
- IBM Alert Notification
- Alert Notification includes a mobile app that offers a subset of Alert Notification functions on iOS and Android devices.
- You can monitor the IBM integration stack to see transaction tracking information for the IBM MQ, IBM Integration Bus, and DataPower® appliance middleware products and the services they expose and troubleshoot if any problems arise. See Scenario: Monitoring the IBM integration stack.
-
- Monitoring Agent for Db2®
- Commands were added for granting privileges to the default user (for Windows systems) and instance owner user (for Linux® and AIX® systems) for viewing the data for some of the Db2 agent attributes.
- Monitoring Agent for Hadoop
- The Hadoop agent is supported on Linux, Windows, and AIX operating systems.
- Monitoring Agent for HMC Base
- Monitoring capabilities are provided for virtual I/O and for hardware events.
- Monitoring Agent for IBM Integration Bus
-
The library path of the latest version of IBM MQ (WebSphere® MQ) can be automatically discovered during agent configuration on Linux and AIX systems.
- Monitoring Agent for Microsoft Cluster Server
- The Microsoft Cluster Server agent gets automatically configured after it is installed.
- Monitoring Agent for Microsoft Exchange Server
- Some additional services were added in the Exchange Services tab of the agent configuration window for determining the Exchange Server status.
- Monitoring Agent for Microsoft Hyper-V Server
- Removed the agent configuration panel. The agent configuration is not required.
- Monitoring Agent for SAP HANA Database
- The Cache Information Details group widget was added in the SAP HANA Database Details dashboard to provide information about the percentage of used memory, percentage of available memory, and hit ratio of the cache for the monitored database.
- Monitoring Agent for Synthetic Playback
- The Synthetic Playback
agent includes the
following features:
- You can install and configure the Synthetic Playback agent to monitor the performance and availability of private, internal-facing applications on the Application Performance Dashboard, in addition to public, external-facing applications.
- Use the Synthetic Script Manager to generate a simple script to test the availability and performance of your applications.
- Configure simultaneous or staggered playback of synthetic transactions at different locations.
- Monitor your monthly playback usage in the Synthetic Script Manager.
- View HTTP metrics and availability ratios in Synthetic Playback agent reports.
- View two new reports: Trend of Transactions and Trend of Subtransactions.
- Organize your synthetic transactions into a resource group and apply thresholds to all transactions in that resource group.
- View synthetic transaction data in the My Transactions window in the Application Performance Dashboard without needing to create an application that contains associated synthetic transactions.
- Download synthetic scripts from Synthetic Script Manager.
- Monitoring Agent for VMware VI
- The VMware VI agent dashboard is enhanced
to include the following new features:
- The number of triggered alarms in the critical or warning state are also displayed on the Component page.
- A new table on the Cluster Summary page provides information about the proactive and failure alarms. You can click the triggered entity in the table and view the detail page of that triggered entity.
- A new table on the Cluster Detail page displays details of the ESX servers that belong to the selected cluster. You can click the ESX server and view the detail page of that ESX server.
- The Datastore table on the Cluster Detail page shows the over-commitment metric of the datastore.
- The Virtual Machines table on VM Detail page displays more performance metrics such as memory size, NICs, and disks. You can click these metrics and view their detail pages.
- New widgets and pages are added to display important performance metrics of the memory, disks, and network for the selected virtual machine.
- A new table on the ESX Server Detail page displays the network performance of the server network.
- The Datastore table on the VM Detail page and the ESX Server Detail page displays the latency metric of the datastore.
- A new table on the Datastore Detail page displays information about the virtual machine that is associated with the datastore. You can click the virtual machine in the table and view the Virtual Machine Detail page.
- The title of the % Memory (History) chart on the VM detail page was changed to Guest Memory(History).
- Monitoring Agent for WebSphere Applications
- The In-flight Requests Summary dashboard provides the capability to identify the request
instances that are currently slow or hung. You can perform a soft cancel operation on an in-flight
request by selecting the request and then clicking Cancel Thread in the
In-flight Request widget on this dashboard.
All predefined eventing thresholds were refined to provide a better user experience. The enhancements and updates involve the condition that triggers an alert, the sampling interval, and the severity of the threshold.
The user interface of the Monitoring Agent for WebSphere Applications is accessible to users with physical disabilities.
The configuration process was refined based on customer feedback and technical review to provide a better user experience.
- Monitoring Agent for WebSphere MQ
- Some changes were made to the predefined eventing thresholds:
- All predefined thresholds have a prefix of MQ_ instead of MQSeries_ as in previous versions.
- Two thresholds, MQ_Channel_Initiator_Crit and MQ_Queue_Manager_Crit, were added to trigger critical alerts for the channel initiator server status and queue manager status.
- The trigger condition of the MQ_Queue_Depth_High event was changed from static 80% to the high depth value of the queue.
The name of the Queue not being Read - Top 5 widget was changed to Queue in Use not being Read - Top 5. This widget provides a list of top five queues that have messages and are connected by one or more applications to put messages on the queue, but are not being read by any application.
The library path of the latest version of IBM MQ (WebSphere MQ) can be automatically discovered during agent configuration. You can keep the WMQLIBPATH parameter empty in the silent response file or accept the default value when you configure the agent interactively.
- OS agents
- The OS agents contain a new functionality to monitor application log files. The functionality
includes the capability to configure log file monitoring based on regular expressions.For compatibility, the OS agent consumes the following information and formats:
- Configuration information and the format file that was used by the IBM Tivoli Monitoring 6.x Log File Agent
- Configuration information and format strings that were used by the Tivoli Event Console Log File Adapter
- Response Time Monitoring Agent
-
End User Transactions dashboards include user and device information, which was previously displayed in the Authenticated Users and Mobile Devices Users dashboards in the Users group. User, session, and device information are sorted by location (country, state, and city) based on the IP address of the user. Use the new and updated dashboards to understand user volumes and whether issues are isolated to specific sets of users.
Customize the locations that are applied to specific IP addresses or address ranges in the End User Transaction dashboards for your particular environment. Use the Geolocation tab in the Agent Configuration to customize location values.
- Transaction Tracking
- The Transaction Summary page includes a Service Dependencies topology, which shows the selected resource node, such as an IBM Integration Bus, and the services that it depends on. The Transaction Details page includes a Transaction Dependencies topology that shows a transaction node for each component instance, and an uninstrumented node for each dependent service at the transaction level, for example, IBM Integration Bus and its service transactions. The Transaction Details page also highlights the users of the selected application who are experiencing the slowest response times, and the hosts with the highest volume of transactions.
- General agent enhancements
- The following general agent installation and configuration enhancements were made:
- The agent installation script performs a permissions check before the installation starts. If you do not have adequate permission, a message is displayed.
- The agent status command checks the status between the agent and the Performance Management console.
- Agents that are supported on Windows systems have a GUI utility that you can use to perform agent configuration and check the connection status.
- You can use a new command to remove an agent instance without uninstalling the agent.
-
Performance Management user authentication is managed through an IBMid OpenID Connect provider.
-
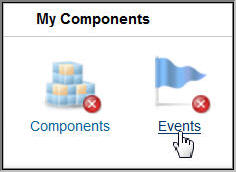
- The Performance Management console appearance was updated to align
with the IBM
Bluemix® user interface. For example, view the differences
between a summary box in the All My Applications dashboard from V8.1.2 and now:
- A new option was added to the Advanced Configuration page so advanced users can easily enable or disable all predefined thresholds across all system groups. See Background information.
- A new option was added to the Advanced Configuration page to control the Application Performance Dashboard automatic refresh rate. For more information, see UI Integration.
- Various improvements were made to the agent installation and configuration interfaces.
- Improvements to the accessibility of the Performance Management console. For information about the accessibility features of the user interface, see Accessibility features.
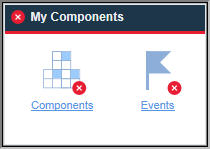
- The Performance Management console appearance was updated to align
with the IBM
Bluemix® user interface. For example, view the differences
between a summary box in the All My Applications dashboard from V8.1.2 and now:
- You can use APIs to create scripts for automating the onboarding of your Performance Management environment. For more information, see Exploring the APIs.
- Agent Builder includes enhanced data set filtering. You can use filtering to create data sets that return a single row based on multi-row data sets including the Availability data set. Use this feature to provide information in summary dashboards.