All My Applications - Application Performance Dashboard
Inventory Management, and for the predefined applications,
My Componentsor
My Transactionsif your environment includes them. From the summary boxes or the navigator, drill down to each application and its constituents to see detailed metrics.
 to open the All My Applications dashboard. View areas of
interest either by selecting from the navigator or by clicking in a summary box to drill down to the
next level.
to open the All My Applications dashboard. View areas of
interest either by selecting from the navigator or by clicking in a summary box to drill down to the
next level. - Summary boxes
- All My Applications has a summary box for each defined application.
Indicators show the highest status severity for the application in the title bar and for each group
in the summary box. The following predefined groups are available, depending on which monitoring
products are included in the defined application:
 Availability Monitoring
has no subgroups
Availability Monitoring
has no subgroups Components has a subgroup for each monitoring agent type that supports your
application
Components has a subgroup for each monitoring agent type that supports your
application-
Transactions can include End User Transactions
and Synthetic Transactions
(IBM® Website
Monitoring on Cloud before the August 2017 release)
subgroups
 Events, which shows the severity of the highest severity event that is open
for the application. You can click the Events link to investigate any open events (see Event Status).
Events, which shows the severity of the highest severity event that is open
for the application. You can click the Events link to investigate any open events (see Event Status).
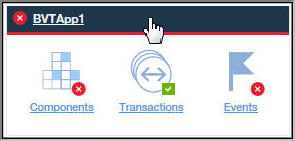 Click a summary box title bar to open the Status Overview tab for the application.
Or click one of the summary box icons to open the Status Overview tab for the Components group or
Users or Transactions subgroup, or to open the Events tab for the application group or subgroup.
You can collapse the summary boxes and filter them by selecting or clearing check boxes:
Click a summary box title bar to open the Status Overview tab for the application.
Or click one of the summary box icons to open the Status Overview tab for the Components group or
Users or Transactions subgroup, or to open the Events tab for the application group or subgroup.
You can collapse the summary boxes and filter them by selecting or clearing check boxes:- To show only the summary box title bars for easy scrolling through your defined applications, clear the Show Details check box.
- To filter the summary boxes for the severity status that you want to hide, clear the check box
for a counter, such as
 . The check box for a severity with no events is disabled. For example, in this graphic, the
filters for Critical and Normal are enabled; Warning and Unknown are disabled because they have a 0
count:
. The check box for a severity with no events is disabled. For example, in this graphic, the
filters for Critical and Normal are enabled; Warning and Unknown are disabled because they have a 0
count:  .
.
- Search
- Use the Search field to find log entries from the past hour that contain the entered text. You
can click
 to show results from a different time range. The Search text is compared to the log
entries that are associated with the navigator selection and any matches are shown in a new browser
tab or window. For instructions, see Searching log files. The search capability is
provided by IBM
Operations Analytics - Log Analysis.
to show results from a different time range. The Search text is compared to the log
entries that are associated with the navigator selection and any matches are shown in a new browser
tab or window. For instructions, see Searching log files. The search capability is
provided by IBM
Operations Analytics - Log Analysis. - Actions
- The Actions menu has options for copying the URL,
opening the dashboard log, and setting a trace for troubleshooting. For more information, see
Copying the dashboard URL and Setting a trace.
Use the Dashboard Log option to review the list of agent dashboards that were updated since the last server restart.
When the All My Applications home dashboard or one of the applications is selected, the Actions menu includes Launch to Reports to help you analyze usage and performance trends if Cognos® based reports are available and your environment includes Tivoli® Common Reporting. For more information, see Reports.
When the Components group is selected, from either the navigator Groups section or from a summary box, the Actions menu includes an Edit option for editing the Component status overview dashboard. The Edit option is only available if the logged in user has the modify permission for Performance Management Dashboard and the create permission for Applications. For more information, see Editing the Components dashboard group widgets.
 Help
Help- Open the pop-up help to get a short description of the current dashboard, with the following links: Learn More opens the full dashboard topic in the local Cloud APM help system; and Take a Dashboard Tour starts the IBM Cloud APM Dashboard tour, which presents a brief description of the dashboard elements as it guides you through the features.
- The navigator displays a hierarchy of defined applications and their users, transactions, and
components that reflects how they are organized. The navigator has a section for each level of the
application hierarchy. At every level of the navigator, the dashboard metrics change to show data
from the component. Select an item to switch the dashboard context to the selection. The scope of
what you can see is determined by your user permissions.
Each navigator item has a
 critical,
  warning,
  normal, or
  unknown status indicator, which indicates that the
agent is unavailable. Each navigator section presents a count of events for each severity that is associated with the selected navigator item. For a mapping
of status to threshold events, see Event Status.
unknown status indicator, which indicates that the
agent is unavailable. Each navigator section presents a count of events for each severity that is associated with the selected navigator item. For a mapping
of status to threshold events, see Event Status.To make more room for other sections, click a title bar to collapse the section, and click again to restore the section. You can also hide the navigator entirely by clicking
 on the navigator border; and restore it by clicking
  , or adjust the width by dragging the
  border.The navigator has three sections:
- The Applications section lists all the defined applications in your domains or that are allowed for your user role.
- After you select an application, the dashboard changes to a high-level status summary in the Status Overview tab, and an indicator of the highest severity status is displayed in the Events tab. For more information, see Application - Application Performance Dashboard.
- If your Cloud APM server is sized as small or medium, a predefined application named My Components is created. The application contains any resource monitoring components in your domain that have been discovered by the monitoring infrastructure and that you are authorized to view. For more information on authorization, see Roles and permissions. My Components cannot be edited or deleted. The event status of the My Components application and its components is based on the status of all components discovered by the monitoring infrastructure and not just the components and component instances that you are authorized to view. For example, if some Linux OS agents have Critical status but all of the Linux OS agents that you are authorized to view have Normal status, then the Linux OS status is Critical for the My Components application even though the status is Normal for all Linux OS agent instances that you see.
- If you have administrator role privileges, the Applications toolbar
includes
 tools for managing applications. For instructions, see Managing applications.
- After you select an application, the Groups section shows the groups that support the application. For more information, see Group and Instance - Application Performance Dashboard.
- After you select a subgroup, the Instances section is renamed for the subgroup title and populated with the individual managed system names. The Status Overview changes to show KPIs for the selected subgroup. After you select a managed system, detailed group widgets are displayed with KPIs from the managed system. For component instances, you also have an Attribute Details tab for viewing a table of KPIs from the data set attributes of your choosing. For more information, see Viewing and managing custom charts and tables.
If you get a Network Error pop-up message in the navigator, the status indicators might change to
normal until after the connection is restored. At that time, any open events are
reprocessed and the status might appear normal until processing is completed. - The Applications section lists all the defined applications in your domains or that are allowed for your user role.