Using the Viewer
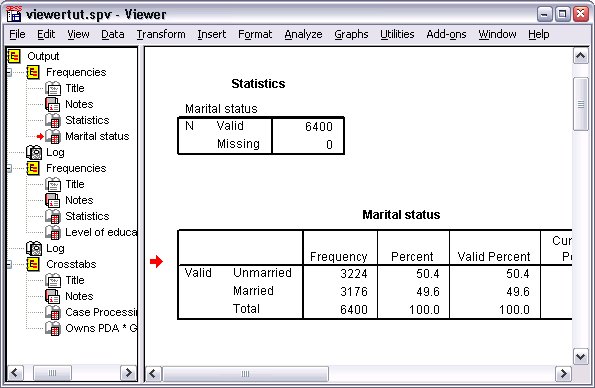
The Viewer window is divided into two panes. The outline pane contains an outline of all of the information stored in the Viewer. The contents pane contains statistical tables, charts, and text output.
Use the scroll bars to navigate through the window's contents, both vertically and horizontally. For easier navigation, click an item in the outline pane to display it in the contents pane.
- Click and drag the right border of the outline
pane to change its width.
An open book icon in the outline pane indicates that it is currently visible in the Viewer, although it may not currently be in the visible portion of the contents pane.
- To hide a table or chart, double-click its
book icon in the outline pane.
The open book icon changes to a closed book icon, signifying that the information associated with it is now hidden.
- To redisplay the hidden output, double-click
the closed book icon.
You can also hide all of the output from a particular statistical procedure or all of the output in the Viewer.
- Click the box with the minus sign (−)
to the left of the procedure whose results you want to hide, or click
the box next to the topmost item in the outline pane to hide all of
the output.
The outline collapses, visually indicating that these results are hidden.
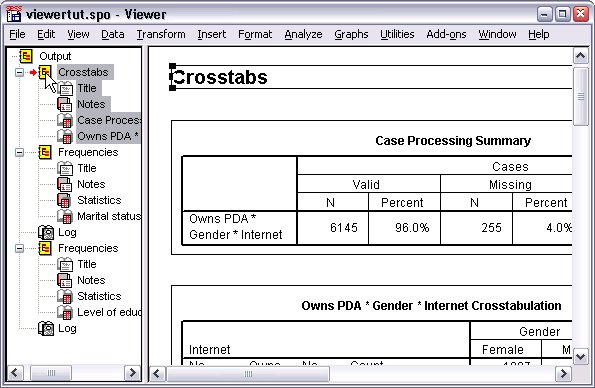
You can also change the order in which the output is displayed.
- In the outline pane, click the items that you want to move.
- Drag the selected items to a new location in the outline.
You can also move output items by clicking and dragging them in the contents pane.