IBM Pattern Modeling and Analysis Tool
for Java Garbage Collector
Creator/Developer
Jinwoo Hwang
jinwoo@us.ibm.com
Welcome to IBM Pattern Modeling and Analysis Tool for Java Garbage Collector. IBM Pattern Modeling and Analysis Tool for Java Garbage Collector allows you to analyze garbage collection activities from IBM Java 2 Platform, Standard Edition 1.3.1 ,1.4.x, 5.0 and 6.0, Solaris Java Runtime Environment 1.4.1,1.4.2, 5.0, 6.0 and 7.0 and HP-UX Java Runtime Environment 1.4.1,1.4.2, 5.0,6.0 and 7.0.
Introduction
When the JVM cannot allocate an object from the current heap because of lack of space, a memory allocation fault occurs, and the Garbage Collector is invoked. The first task of the Garbage Collector is to collect all the garbage that is in the heap. This process starts when any thread calls the Garbage Collector either indirectly as a result of allocation failure, or directly by a specific call to System.gc(). The first step is to get all the locks that the garbage collection process needs. This step ensures that other threads are not suspended while they are holding critical locks. All the other threads are then suspended. Garbage collection can then begin. It occurs in three phases: Mark Sweep and Compaction (optional).
Verbose GC is a command-line option that you supply to the JVM at startup time. The format is: -verbose:gc or �verbosegc (-Xverbosegc on HP-UX). This option switches on a substantial trace of every garbage collection cycle. The format for the generated information is not architected and therefore varies from platform to platform and release to release.
This trace should allow you to see the gross heap usage in every garbage collection cycle. For example, you could monitor the output to see the changes in the free heap space and the total heap space. You can use this information to determine:
Whether garbage collections are taking too long to run
Whether too many garbage collections are occurring
Whether the JVM crashed during garbage collection
Output typically looks like this:
<AF[1]: Allocation Failure. need 1544 bytes, 0 ms since last AF>
<AF[1]: managing allocation failure, action=1 (0/3983128) (209640/209640)>
<GC(1): GC cycle started Tue Apr 24 10:49:58 2001>
<GC(1): freed 1421672 bytes, 38% free (1631312/4192768), in 9 ms>
<GC(1): mark: 8 ms, sweep: 1 ms, compact: 0 ms>
<GC(1): refs: soft 0 (age >= 32), weak 17, final 16, phantom 0>
<AF[1]: completed in 10 ms>
Notes:
1. GC(1): The 1st garbage collection cycle in this JVM.
2. freed 1,421,672 bytes: An indication of the amount of activity since the last garbage collection cycle.
IBM Pattern Modeling and Analysis Tool for Java Garbage Collector is provided �as-is�.
Prerequisite
� Java 2
Runtime Environment 6 or higher
The following exception will be thrown if older versions SDK is used:
Exception in thread "main" java.lang.NoClassDefFoundError:
java/util/regex/PatternSyntaxException
� Log files with -verbosegc enabled on IBM Java 2 Platform, Standard Edition 1.3.1, 1.4.x, 5.0, 6.0 and 7.0 and Solaris Java Runtime Environment 1.4.1/1.4.2, 5.0, 6.0 and 7.0
� Log files with �Xverbosegc enabled on HP-UX Java Runtime Environment 1.4.1/1.4.2, 5.0, 6.0 and 7.0
Definitions of headers in tables/charts
� Since Time(millisecond) elapsed since last allocation failure.
� Freed Size(byte) of space that was freed during garbage collection.
� Needed/Requested Size(byte) of space that was requested during allocation failure.
� Free Size(byte) of space that was free after garbage collection.
� Total Size(byte) of Java heap after garbage collection.
� Completed Time(millisecond) spent during allocation failure.
� GC Completed or GC Time(millisecond) spent during garbage collection.
� Overhead Time(%) spent in allocation failure
� Mark Time(millisecond) spent in mark phase
� Sweep Time(millisecond) spent in sweep phase.
� Compact Time(millisecond) spent in compact phase.
� Exhausted Whether there was insufficient space to satisfy allocation failure.
Features
� Java 2 SE 1.4/5.0/6.0/7.0 verbosegc trace support
� Headless customized report generation
� Java error message analysis and recommendation report
� Solaris and HP-UX Java Runtime Environment 1.4.1/1.4.2/5.0/6.0/7.0 -verbosegc and �Xverbosegc trace support
� Statistics report
� IBM Java 2 Platform, Standard Edition 1.3.1/1.4.1/1.4.2/5.0/6.0/7.0 verbosegc trace support
� Selective gc cycle
� Zoom Y axis in chart view
� command line option for verbosegc trace file
� GC analysis
� GC Table View
� AF summary
� GC usage summary
� GC duration summary
� GC Graph View
� GC pattern analysis
� Zoom in/out/selection/center of graph view
� Option to change chart color
Common problems
1.If there�s java.lang.OutOfMemoryError while you are processing verbosegc log, please try increasing the maximum heap size (-Xmx) value to give the JVM more memory. Maximum heap size should not be larger than the size of available physical memory size for this tool due to performance issue.
2.If there�s java.text.ParseException from the traces that was generated in different locale, you need to change locale.
For example, you are running the tool with US English locale against traces generated on German locale. You might see the following exception:
Date ParseException while parsing line 2,242,842 : <af type="tenured" id="1" timestamp="Jul 11 11:39:21 2012" intervalms="0.000">
java.text.ParseException: Unparseable date: "Jul 11 11:39:21 2012"
at java.text.DateFormat.parse(DateFormat.java:352)
at com.ibm.jinwoo.gc.FileTask.processJ9(FileTask.java:2188)
at com.ibm.jinwoo.gc.FileTask$ActualTask.<init>(FileTask.java:221)
at com.ibm.jinwoo.gc.FileTask$1.construct(FileTask.java:1684)
at com.ibm.jinwoo.gc.ThreadHandler$1.run(ThreadHandler.java:23)
at java.lang.Thread.run(Thread.java:810)
You need to start the tool with the locale that trace was generated with.
This is written German. So you can start the tool with on non-German environment:
java -Duser.language=de �Duser.country=DE -jar ga421.jar
Feel free to contact me if you have any comments or suggestions.
How to run this tool
You need to use the Java 2 Platform, Standard Edition version 6 or higher Java Runtime Environment (JRE) to run IBM Pattern Modeling and Analysis Tool for Java Garbage Collector.
Usage <Java path>java �Xmx[heap size] �jar ga<version>.jar [-I|-S|-X] [verbosegc trace files separated by path delimiter] [[analysis output HTML file] [SELECTIVE_GRAPH_OPTION_FOR_HTML_OUTPUT]]
[NOTE]
-I : IBM verbosegc trace (default)
-S : Solaris verbosegc trace
-X : HP-UX Xverbosegc trace
Path delimiter on Windows systems is semicolon ;
Path delimiter on Unix systems is colon :
SELECTIVE_GRAPH_OPTION_FOR_HTML_OUTPUT: This option is available only with [analysis output HTML file]
� R Requested Java Heap Size After Garbage Collection
� I Interval between Garbage Collections
� A Allocation Failure Duration
� M Mark Phase Duration
� S Sweep Phase Duration
� C Compact Phase Duration
� D Garbage Collection Duration
� O Garbage Collection Overhead
� U Used (Tenured/Tenured+New) Java Heap Size After Garbage Collection
� F Free (Tenured/Tenured+New) Java Heap Size After Garbage Collection
� T Total (Tenured/Tenured+New) Java Heap Size After Garbage Collection
� N Used Nursery/New Java Heap Size After Garbage Collection
� P Used Permanent Java Heap Size After Garbage Collection
� Q Used Nursery/New Java Heap Size After Garbage Collection
� Y Total Nursery/New Java Heap Size After Garbage Collection
� B Combine all in one chart
For example, the following will process IBM verbosegc trace in native_stdout.txt and native_stdout2.txt:
java �Xmx1000m �jar ga412.jar native_stdout.txt;native_stdout2.txt (On Windows system)
java �Xmx1000m �jar ga412.jar �I native_stdout.txt:native_stdout2.txt (On AIX system)
The following will process IBM verbosegc trace in native_stdout.txt and native_stdout2.txt and generate analysis output in output.html without invoking graphical user interface of IBM Pattern Modeling and Analysis Tool for Java Garbage Collector:
java �Xmx1000m �jar ga12.jar �I native_stdout.txt;native_stdout2.txt output.html (On Windows system)
The following will process IBM verbosegc trace in native_stdout.txt and native_stdout2.txt and generate analysis output in output.html without invoking graphical user interface of IBM Pattern Modeling and Analysis Tool for Java Garbage Collector. There will be only 3 charts:
Used (Tenured/Tenured+New) Java Heap Size After Garbage Collection
Free (Tenured/Tenured+New) Java Heap Size After Garbage Collection
Total (Tenured/Tenured+New) Java Heap Size After Garbage Collection
java �Xmx1000m �jar ga12.jar �I native_stdout.txt;native_stdout2.txt output.html UFT(On Windows system)
The following will process IBM verbosegc trace in native_stdout.txt and native_stdout2.txt and generate analysis output in output.html without invoking graphical user interface of IBM Pattern Modeling and Analysis Tool for Java Garbage Collector. There will be one chart showing the following (B option combines all in one chart):
Used (Tenured/Tenured+New) Java Heap Size After
Garbage Collection
Free (Tenured/Tenured+New) Java Heap Size After Garbage Collection
Total (Tenured/Tenured+New) Java Heap Size After Garbage Collection
java �Xmx1000m �jar ga12.jar �I native_stdout.txt;native_stdout2.txt output.html UFTB(On Windows system)
The following is a snapshot of HTML analysis output with FTB options enabled:

1. Start the IBM Pattern Modeling and Analysis Tool for Java Garbage Collector
IBM Pattern Modeling and Analysis Tool for Java Garbage Collector is displayed with console window.

2. Open verbosegc log by clicking on File->Open

3. Select verbosegc log

4. Progress bars are displayed while processing verbosegc log

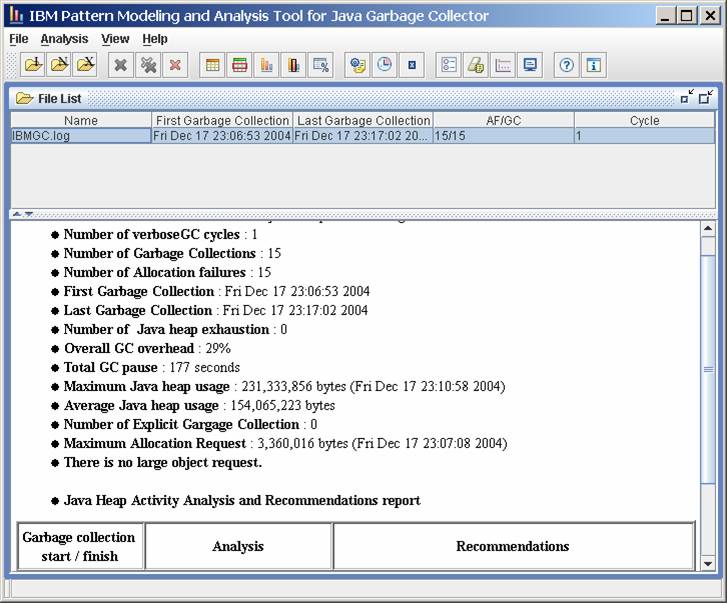
5. Analysis is displayed when processing is completed.
Statistics of verbosegc data is displayed as well as analysis of each errors.
6. If there�s no major error in a verbosegc cycle, trend analysis is provided.
If trend ratio is closer to 0, memory usage is more stable based on model in a cycle.
If trend ratio is non-zero, memory usage could increase over time.
If there are not enough activities in a cycle, the model might not be accurate. If percentage error is large, the model might not be reliable.

7. Display GC table view by clicking on Analysis -> GC View All

8. The following is GC Table View.
You can sort each column by clicking on column header.
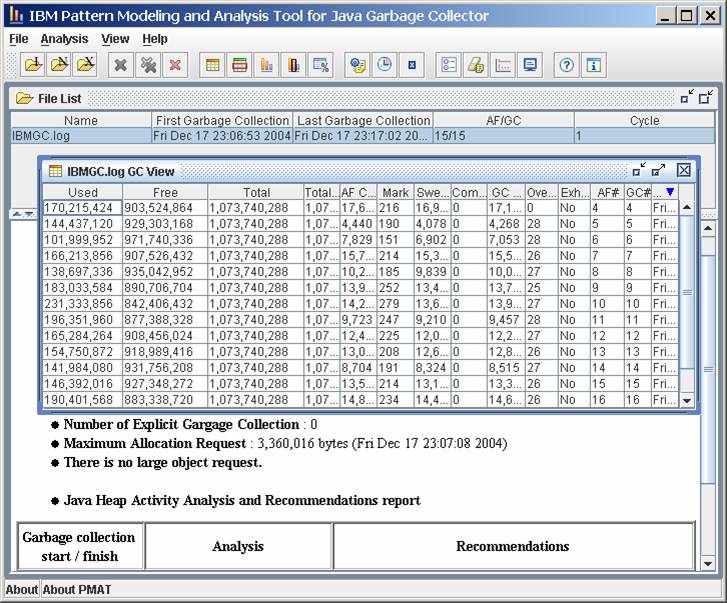
By clicking on right mouse button, you can hide/show columns.

9. GC View sorted by Free

10. Display chart by clicking on Analysis->Graph View

11. The following is Graph View

12. Red vertical dotted line represents �Exhausted�, where there was insufficient space to satisfy allocation failure. You can click on buttons to display other data ( Used, Free and so on) Black vertical dotted line represents end point of a JVM runtime.

13. Compact buttons is enabled.
You can click on Zoom In/Out and Center to navigate chart in various levels.

14. You can select a point to display its table view

15. Display usage summary by clicking on Analysis->Usage Summary

16. Usage Summary of each GC cycle is displayed

17. Duration Summary by clicking on Analysis-.Duration Summary
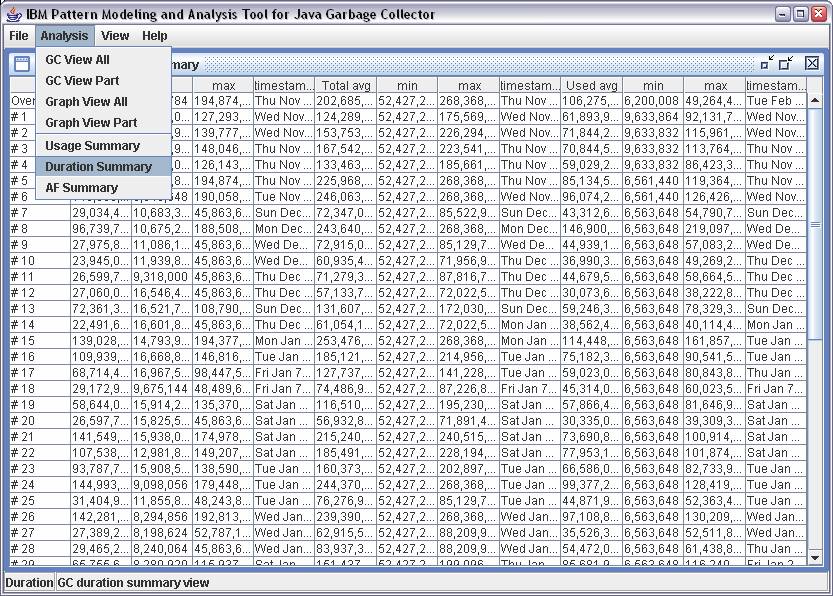
18. Duration Summary of each GC cycle is displayed.

19. AF Summary by clicking on Analysis->AF Summary

20. AF summary of each AF cycle is displayed

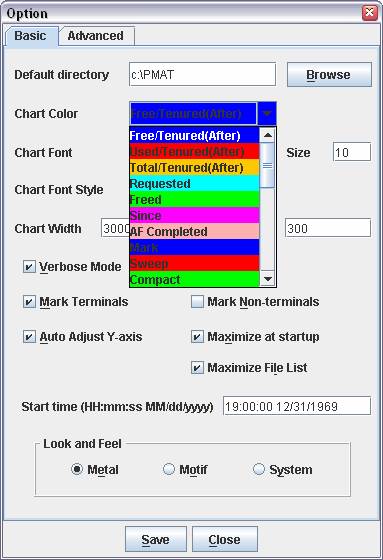
21. Display option by clicking on View->Option

22. You can change default directory as well as the following settings:
- Verbose Mode: display messages in console
- Save option: Saves options to configuration file during exit
- Mark Terminals: Mark points of start/end
- Mark non-terminals: Mark points except for start and end
- Auto Adjust Y-axis : Chart view adjusts Y-axis automatically
- Maximize at startup : Maximize frame at startup
- Maximize File List : Maximize file list frame after reading
- Chart Color : Color of each counter
- Chart Font, size and style
- Chart Width and height generated in analysis output HTML file
- Start time : Some vendors� traces do not provide start time. This time is used as start up time of trace.

23. You can also change color of chart

Advanced option will change analysis result based on each threshold option.
DO NOT CHANGE THESE SETTINGS WITHOUT KNOWING WHAT THEY ARE.
In the following screen,
If the requested object size is smaller than 30% of available space, it will be diagnosed as �Fragmentation�.
If it�s not fragmentation and the requested object size is larger than 10MB, it will be diagnosed as �Too large object request�.
If available space is smaller than 10% of total space, it�s diagnosed as �Heap exhaustion�.
Overhead ratio is not used in this release.

24. You can clear logs in console by clicking on View->Clear Console

25. You can check version of IBM Pattern Modeling and Analysis Tool for Java Garbage Collector by clicking on Help->About

26. You can access help topics by clicking on Help->Help Topics menu.

27. Statistics report can be accessed from Analysis menu to display following information:
- File name
- Number of all Garbage Collections
- Number of Full Garbage Collections
- Number of Minor Garbage Collections
- Total Garbage Collection pause
- Average Garbage Collection pause
- Total Full Garbage Collection pause
- Average Full Garbage Collection pause
- Total Minor Garbage Collection pause
- Average Minor Garbage Collection pause
- Total Garbage Collection interval
- Average Garbage Collection interval
- Total Full Garbage Collection interval
- Average Full Garbage Collection interval
- Total Minor Garbage Collection interval
- Average Minor Garbage Collection interval
- Total collected bytes by Garbage Collection
- Average collected bytes by Garbage Collection
- Total collected bytes by Full Garbage Collection
- Average collected bytes by Full Garbage Collection
- Total collected bytes by Minor Garbage Collection
- Average collected bytes by Minor Garbage Collection
The following is a sample snapshot of Statistics report:

Copyrights and notices
(C) Copyright IBM Corporation 2005-2012. All Rights Reserved. Note to U.S. Government Users Restricted Rights -- Use, duplication or disclosure restricted by GSA ADP Schedule Contract with IBM Corp.
AIX, Cloudscape, DB2, IBM, iSeries, OS/390, WebSphere, and z/OS are trademarks or registered trademarks of IBM Corporation in the United States and/or other countries.
Java and all Java-based trademarks and logos are trademarks of Sun Microsystems, Inc. in the United States and/or other countries.
Microsoft, Windows, and Windows NT are trademarks of Microsoft Corporation in the United States and/or other countries.
UNIX is a registered trademark of The Open Group.
Other company, product, and service names may be trademarks or service marks of others.
The following paragraph does not apply to the United Kingdom or any other country where such provisions are inconsistent with local law:
INTERNATIONAL BUSINESS MACHINES CORPORATION PROVIDES THIS TOOLS "AS IS" WITHOUT WARRANTY OF ANY KIND, EITHER EXPRESS OR IMPLIED, INCLUDING, BUT NOT LIMITED TO, THE IMPLIED WARRANTIES OR CONDITIONS OF NON-INFRINGEMENT, MERCHANTABILITY OR FITNESS FOR A PARTICULAR PURPOSE. Some states do not allow disclaimer of express or implied warranties in certain transactions, therefore, this statement may not apply to you. This information could include technical inaccuracies or typographical errors. Changes are periodically made to the information herein; these changes will be incorporated in new editions of the tool. IBM may make improvements and/or changes in the product(s) and/or the program(s) described in this tools at any time without notices.