Question & Answer
Question
What are the known issues with Tivoli® Storage Manager Operations Center V7.1.0?
Answer
- User cannot access the Operations Center following an upgrade
- The Operations Center might not open
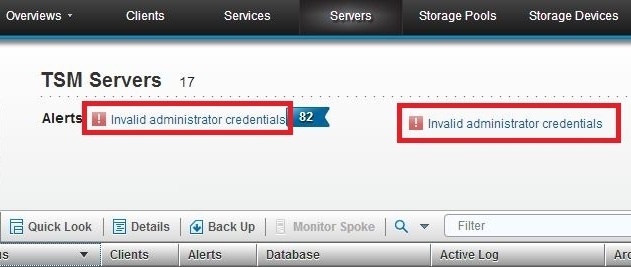
- Message: "Invalid administrator credentials"
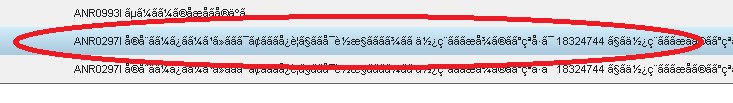
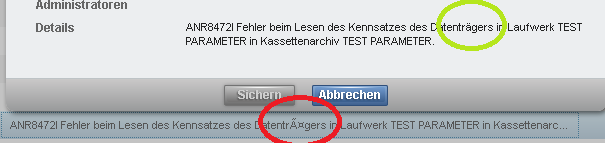
- Mixed languages or corrupted text might be displayed
Overview
Alerts
- Alerts might not be updated immediately
- Alert-related problems might occur after a hub or spoke server is renamed
- Text strings might not be found when you filter alert messages
Clients
- Data protection nodes might be classified as "System" clients
- Virtual machines might be missing from the Operations Center
- Data from a virtual machine might not be displayed in the Operations Center
- Incorrect information might be shown for clients that are proxy-node targets
- Information might be missing from a client Quick Look window, Overview page, or Properties page
- A client might be shown as being at risk even when it is successfully backed up at the scheduled time
- The activity chart might show that data was backed up but that 0 files were backed up
- You can manually back up clients from the Operations Center only if the server scheduling mode is set to PROMPTED
Servers
- A connected spoke server might be shown as being unavailable
- Data might continue to be displayed about a disconnected or removed item
- Communications might time out between the hub server and spoke servers
- Message: "ANR3218E UPDATE ADMIN: Administrator IBM-OC-server_name is a managed object and cannot be updated"
- Sessions and maintenance processes might be reported for periods of server downtime
- Message: "No related messages were logged during the process or session"
- Active tasks might not be canceled immediately
- The number of active tasks to be canceled might be less than the number you selected
Storage pools
Storage devices
- A warning or error might be displayed for disk storage
- A warning or error might be displayed for disk storage even if all directories are available
Command-line interface
- The activity log might contain messages that seem to be out of place
- Message: "java.lang.OutOfMemoryError: Java heap space"
Help information
- Corrections to help information in all languages
- Corrections to help information in languages other than English
Symptom
After you upgrade the Operations Center and try to access it for the first time, the following error message is displayed:
"The administrator name or password is not valid."
Cause
One or more browser windows that were used to access the Operations Center remained open during the upgrade process.
Solution
To resolve the issue, log in again. Use the same browser window that you used for your first login attempt.
Symptom
When you enter a URL in a web browser to open the Operations Center, an unexpected page is displayed, and the Operations Center does not open.
Cause
You might have entered one of the following incorrect URLs:
http://hostname:port
https://hostname:secure_port
https://hostname:secure_port/OC
Solution
The Operations Center opens only if you include /oc in lowercase at the end of the URL. Enter the following URL:
https://hostname:secure_port/oc
where hostname represents the name of the computer where the Operations Center is installed, and secure_port represents the port number that the Operations Center uses for HTTPS communication on that computer. If a port number for HTTPS communication was not specified during Operations Center installation, the default port number is 11090.
Symptom
The error message "Invalid administrator credentials" is displayed on various pages of the Operations Center.
Cause
When you log in to the Operations Center, several short server sessions are created and are associated with your administrator password. The password remains valid for these initial sessions until they end. If you change your administrator password within approximately 3 minutes of logging in, the sessions might not yet have ended and do not accept the new password.
Solution
Log out of the Operations Center, and wait a few minutes before you log back in.
Symptoms
One or more of the following symptoms are present:
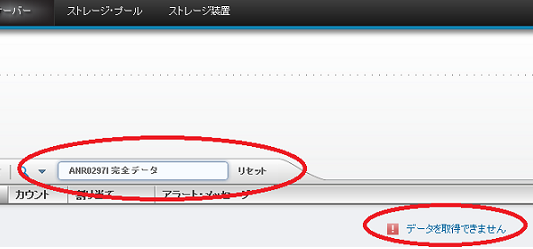
- Alert messages and process status are displayed in more than one language.
- Some text is unreadable; for example: ã¹ãã¬ã¼ã¸ã»ãã¼ã«.
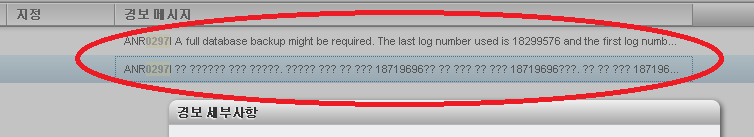
- Some text is replaced with question marks; for example:
- Activity log messages that are associated with alerts are not found.
ANR0297I ?? ?????? ??? ????
Cause
The hub and spoke servers might be configured to display messages in different languages. If, for example, a spoke server that is configured to display messages in Japanese connects to a hub server that is configured to display messages in English, the Operations Center displays corrupted text in place of the Japanese text.
Also, one or more spoke servers might be running Tivoli Storage Manager V6.3.4.
Solution
Take one or more of the following actions:
- Instead of viewing alerts and the activity log on the general Alerts page (Overviews > Alerts), switch to the Alerts page of an individual server (Servers > Details > Alerts). Text is not corrupted on the Alerts page of the individual server.
- Configure the language packages of hub and spoke servers so that the servers display messages in the same language.
- Upgrade spoke servers to Tivoli Storage Manager V7.1.0. Note that this solution might not resolve all symptoms.
Return to list
Symptom
On the Overview page of the Operations Center, the Active Tasks area includes a count of the server processes that are currently active. The count includes processes to identify duplicates even if the processes are idle.
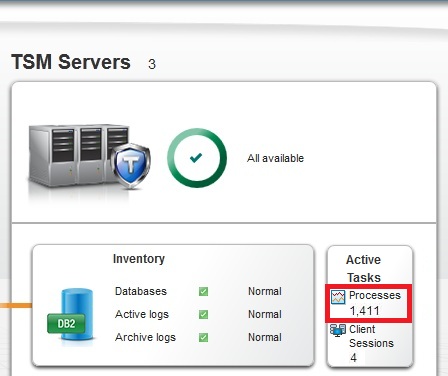
Solution
Determine how many of the processes are idle processes for identifying duplicates by completing the following steps:
- Issue the QUERY PROCESS command.
- In the command output, check the Process Status column for processes that are marked "Status: idle."
Return to list
Symptom
On the Alerts page of the Operations Center, when you attempt to assign multiple alerts to an administrator, or to close multiple alerts, the alerts are not assigned or closed immediately.
The table shows sample data from one test environment when an administrator updated multiple alerts. These results might differ from the results in your storage environment.
Table 1. Approximate delay times when alerts were updated in a controlled environment
Number of alerts updated | Delay for hub-server alerts | Delay for alerts from spoke servers with Tivoli Storage Manager V7.1.0 | Delay for alerts from spoke servers with Tivoli Storage Manager V6.3.4 |
| 1 | 6 seconds | 7 seconds | 7 seconds |
| 10 | 6 seconds | 7 seconds | 9 seconds |
| 100 | 6 seconds | 8 seconds | 40 seconds |
| 1,000 | 10 seconds | 20 seconds | 5.5 minutes |
| 10,000 | 45 seconds | 1.25 minutes | 1 hour |
Solution
Wait until the alerts are updated, or update fewer alerts at a time. For faster response rates, upgrade spoke servers that are running Tivoli Storage Manager V6.3.4 to Tivoli Storage Manager V7.1.0.
Symptoms
One or more of the following symptoms are present:
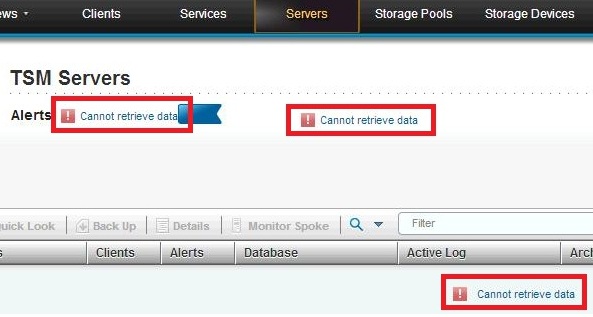
- The QUERY ALERTSTATUS command shows duplicate alerts.
- The table on the Alerts page in the Operations Center does not load, and the following message is displayed: "Cannot retrieve data."
- You cannot view or manage alerts in the Operations Center.
Cause
After you configured a hub server or spoke server, you might have renamed the server by issuing the RENAME SERVER command.
Solution
Close duplicate alerts on the hub and spoke servers by using the UPDATE ALERTSTATUS command.
Do not rename servers that are configured as hub or spoke servers. For the correct procedures to change a hub server or to remove a spoke server, search for "Changing the Operations Center configuration" in the Tivoli Storage Manager documentation.
Symptom
On the Alerts page of the Operations Center, you filter the contents of the Alert Message column by searching for a text string. No messages are found even though the column contains messages that include the text string.
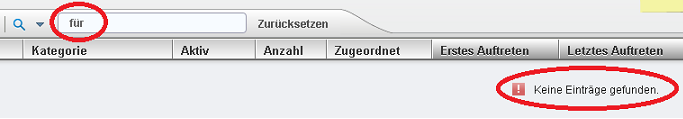
Cause
You might have searched the Alert Message column for a text string that contains non-ASCII characters.
You can search this column only for text strings that contain the letters A - Z and a - z, the numbers 0 - 9, and other ASCII characters. No messages are found if you search, for example, for a Chinese, Japanese, Korean, or Russian word, or a word that includes letters with a diacritical mark (for example, á, è, ü, ô, ç, ñ).
This issue relates specifically to the Alert Message column. Messages might be found if you search all columns, and the text string is contained in another column.
Solution
When you search the Alert Message column, do not enter non-ASCII characters in the filter field. To search for specific messages, search for the message number, for example, ANR0297I, which contains only ASCII characters.
Symptoms
One or more of the following symptoms are present:
- The Operations Center incorrectly classifies one of the following types of Tivoli Storage Manager data protection nodes (TDP nodes) as a "System" client rather than an "Application" client:
- Tivoli Storage Manager for Virtual Environments - Data Protection for VMware nodes
- Tivoli Storage Manager for Databases - Data Protection for Oracle nodes
- Tivoli Storage Manager for Databases - Data Protection for Microsoft SQL Server nodes
- Tivoli Storage Manager for Enterprise Resource Management - Data Protection for SAP nodes
- On the Overview page of the Operations Center, virtual machines are missing from the Virtual Machines count.
- On the Clients page, virtual machines are missing from the table.
A backup-archive client might have used the credentials of a data protection node to connect to the Tivoli Storage Manager server.
The name of the platform for the data protection node (for example, TDP VMware, TSM4VE, or TDP Oracle AIX), which is stored on the server, changes to the name of the platform on which the backup-archive client is running (for example, WinNT or AIX).
The Operations Center incorrectly classifies the data protection node as a "System" client. If the data protection node is a datacenter node that manages virtual machines, these virtual machines are removed from the Operations Center.
Solution
Investigate which backup-archive clients are using the credentials of the data protection node to connect to the Tivoli Storage Manager server, and prevent them from doing so.
Additionally, you can take one of the following actions:
- Wait until the next time that the proxy-node agent for the data protection node connects to the Tivoli Storage Manager server. The name of the platform for the data protection node reverts to the correct name (for example, TDP VMware, TSM4VE, or TDP Oracle AIX). Missing virtual machines are displayed again in the Operations Center.
- Manually change the name of the platform for the data protection node on the server by issuing the UPDATE NODE command, as in the following example:
update node node_name platform="TSM4VE"
Note: The PLATFORM parameter is purposely not described in the help information for the UPDATE NODE command. You can use the parameter as part of the solution to this known issue. However, do not use the parameter in general, for example, to change the platform name that is stored on the server for other clients. The parameter is automatically reset every time that the client accesses the server.
Return to list
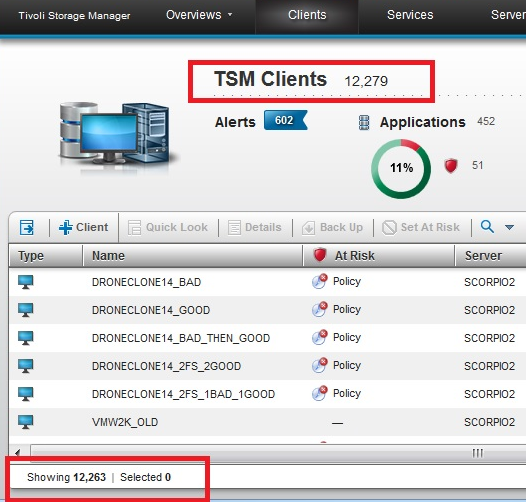
Symptoms
On the Clients page of the Operations Center, the total number of clients is different in the following places:
- At the top of the page, after the title "TSM Clients"
- In the lower-left corner of the table, when the table is unfiltered
Cause
This issue applies when at least one of the spoke servers is running Tivoli Storage Manager V6.3.4. Information for one or more virtual machines is not displayed in the Operations Center when two or more virtual machines have names that differ only in case, for example, "WIN2008R2VM1" and "win2008r2VM1."
The Operations Center converts all letters in the names to uppercase, which causes duplicate names to occur. Data from only one of the virtual machines with the same name is displayed in the Operations Center.
Solution
Complete one of the following procedures:
- Upgrade spoke servers from Tivoli Storage Manager V6.3.4 to a later version.
- If two virtual machines have the same name, differing only in case, complete the following steps.
- Rename one of the virtual machines.
- Verify that a successful backup occurs for the renamed virtual machine.
- From the command-line interface, issue the QUERY FILESPACE command, and locate the previous name of the virtual machine whose name you changed.
- Delete the file space that has the previous name by issuing the DELETE FILESPACE command.
Attention: In this procedure, you delete a file space. When you delete a file space, data that was backed up, and which belongs to the file space, is also deleted.
Symptom
At-risk states, last-access dates, and other information are incorrect in the Operations Center for clients that are proxy-node targets.
Cause
Clients that are proxy-node agents back up data on behalf of other clients, which are called proxy-node targets. However, these backups are not always reflected in the information about the proxy-node targets in the Operations Center.
For example, a client that is a proxy-node target might be shown as being at risk. However, it might not be at risk if it was backed up by proxy-node agents.
Conversely, a client that is a proxy-node target might not be shown as being at risk if it backed up part of the data that it owns. However, it might be at risk if the remaining data that it owns was not correctly backed up by proxy-node agents.
Solution
On the Clients page of the Operations Center, whenever you check the at-risk state of a client, complete the following steps:
- Select the client, and click Quick Look.
- In the General section of the Quick Look window, take note of the names of any proxy-node agents that are listed.
- Close the Quick Look window, and check the at-risk state of the clients that are the proxy-node agents. If none of the proxy-node agents are at risk, the data that they manage for the proxy-node target is backed up and is not at risk.
Return to list
Symptoms
All of the following symptoms are present:
- On the Clients page of the Operations Center, when you select a client and click Quick Look, session details are missing from the Quick Look window.
- When you click Details, all information except current sessions is missing from the client Overview page.
- Session details are missing from the client Properties page.
Cause
The client might be a Tivoli Storage Manager source server in a server-to-server configuration. In this configuration, the source server stores data as virtual volumes on a target server. The source server is registered as a client of type SERVER at the target server.
In the Operations Center, clients of type SERVER are one of a number of client types that are grouped under the label "Systems." To display full information about clients of type SERVER, the Operations Center should treat these clients differently from other client types under "Systems." However, the Operations Center does not distinguish among these different client types.
Solution
To view properties of the client, issue the following command:
query node node_name type=server format=detailed
Note: The symptoms of this issue might be caused by a different issue. See A client might be shown as being at risk even when it is successfully backed up at the scheduled time.
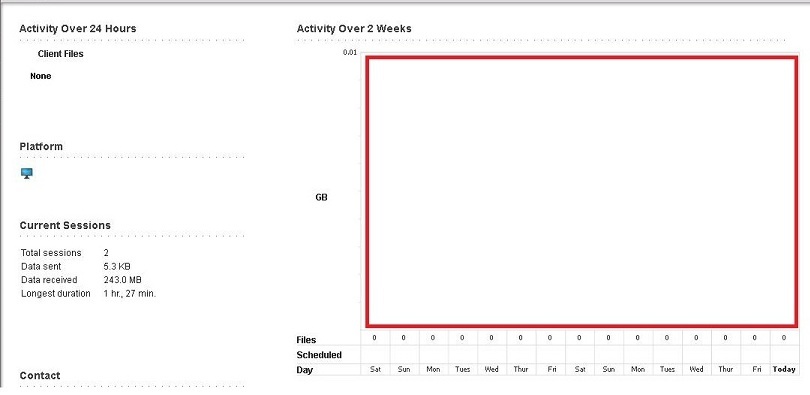
Symptoms
All of the following symptoms are present:
- On the Clients page of the Operations Center, a client has an at-risk status of "Policy," even when the client was successfully backed up at the scheduled time.
- When you select the client and click Quick Look, session details are missing from the Quick Look window.
- When you click Details, the activity graphs on the client Overview page are blank.
- Session details are missing from the client Properties page.
Backup summary records might not have been created for the client on the Tivoli Storage Manager server. All events for the client might be disabled on the Tivoli Storage Manager server.
Diagnosing
To check whether backup summary records were created for the client, issue a SELECT command, as in the following example:
SERVER1> select * from summary where (entity='DISKNODE1' and activity='BACKUP')
ANR2034E SELECT: No match found using this criteria.
To check whether events for the client are enabled, issue a QUERY command, as in the following example:
SERVER1> query enabled actlog node=disknode1
All client events are DISABLED for node DISKNODE1 for the ACTLOG receiver.
Solution
Enable events for the client, as in the following example:
SERVER1> enable events actlog all node=disknode1
ANR1844I ENABLE EVENTS command processed.
Note: Some of the symptoms of this issue might be caused by a different issue. See Information might be missing from a client Quick Look window, Overview page, or Properties page.
Symptom
On the Clients page of the Operations Center, when you select a client that is a data mover node in a virtual environment and you click Details, the Overview page for the node is displayed. The "Activity Over 2 Weeks" bar chart reports that 0 files were backed up or archived, even when bars of the chart indicate that data was backed up or archived.
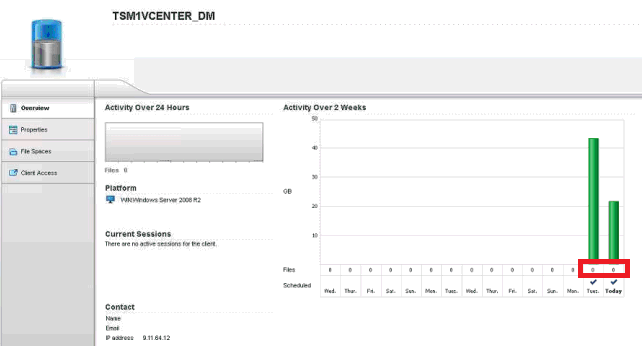
Cause
Data mover nodes report when an entire virtual machine is successfully backed up or archived. They do not report the number of files that were backed up or archived from the virtual machines.
Solution
Ignore the indication that 0 files were backed up or archived when the bar in the chart indicates that data was backed up or archived.
Symptoms
On the Clients page of the Operations Center, when you select a client, the Back Up button remains inactive. When you hover the mouse pointer over the Back Up button, the following message is displayed:
"This action is only available for clients that are registered to servers that use the server-prompted scheduling mode."
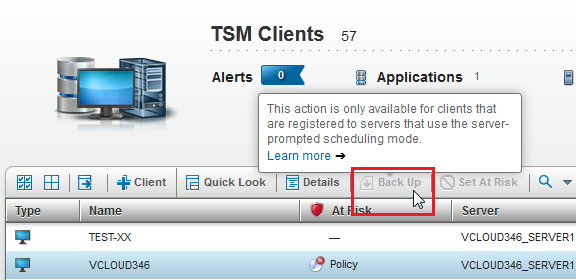
Cause
You cannot back up a client from the Operations Center if the scheduling mode on the server is set to POLLING or to ANY.
Diagnosis
To view the scheduling mode of the server, complete the following steps:
- On the Clients page of the Operations Center, take note of the name of the server that manages the selected client.
- On the Servers page, select the server that manages the client, and click Details.
- Click the Properties tab.
- Open the Sessions and Schedules section.
- View the value that is set for the property Poll by client or prompt by server. This property is the scheduling mode.
Solution
You can manually back up the client by using one of the following methods:
- Whether the server scheduling mode is set to PROMPTED, POLLING, or ANY, you can back up the client from the server by issuing the DEFINE CLIENTACTION command.
- You can back up the client from the Operations Center by completing the following steps:
- Ensure that the client scheduler is running on the client workstation.
- In the dsm.opt file on the client, set the schedmode option to prompted.
- If necessary, specify values for the tcpclientaddress and tcpclientport options in the dsm.opt file.
- On the server Properties page of the Operations Center, set the property Poll by client or prompt by server to PROMPTED.
Attention: The value of this property applies for all clients that are managed by the server. When you set this property to PROMPTED, all clients that were previously configured to poll the server at scheduled times no longer poll the server. - On the Clients page of the Operations Center, select the client, and click Back Up.
- You can back up the client from the client itself by issuing the dsmc command or by using the client GUI.
Note: The time that the client requires to process this command depends on the scheduling mode.
Return to list
Symptom
- You recently connected a spoke server to the hub server or restarted a spoke server.
- The Servers page of the Operations Center unexpectedly displays the spoke server as being unavailable.
Cause
The spoke server might be running Tivoli Storage Manager V6.3.4, and the clock on the spoke server might lag the clock on the hub server. The spoke server is shown as being unavailable until the time on the spoke server clock reaches the time at which the connection was made according to the hub server clock.
Solution
Synchronize the clocks on the hub server and spoke servers. If possible, use an internet time service to automatically synchronize the clocks. Alternatively, upgrade the spoke server from Tivoli Storage Manager V6.3.4 to a later version.
Symptoms
1. One of the following events occurs:
- A connection is lost between the hub server and a spoke server.
- You halt a spoke server.
- You remove a client, policy, storage pool, or storage device that is managed by a spoke server.
Cause
The spoke server might be running Tivoli Storage Manager V6.3.4, and the clock on the hub server might lag the clock on the spoke server. The Operations Center continues to show the spoke server data until the time on the hub server clock reaches the time at which the connection was lost on the spoke server clock.
Solution
Synchronize the clocks on the hub server and spoke servers. If possible, use an internet time service to automatically synchronize the clocks. Alternatively, upgrade the spoke server from Tivoli Storage Manager V6.3.4 to a later version.
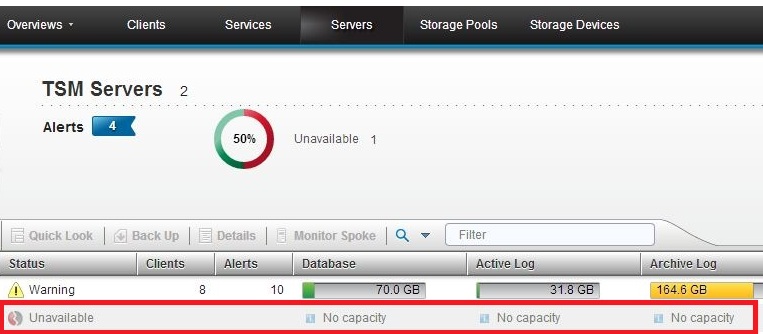
Symptoms
One or more of the following symptoms are present:
- Spoke servers report messages that are similar to the following examples:
- The hub server reports messages that are similar to the following examples:
- On the Servers page of the Operations Center, a status of "Unavailable" is displayed for spoke servers.
- On the same page, the database, active log, or archive log bars show no capacity, even if a status of "Normal" is displayed for spoke servers.
- Sessions between the hub server and the spoke servers are restarted automatically.
ANR8216W The server experienced a TCP/IP error while sending data on
socket 79. Reason 32.
ANR0481W Session 9339 for node IBM-OC-ADMIN (AIX) terminated -
client did not respond within 60 seconds.
ANR1987E A communication error occurred during session 123 with
monitored server SPOKE1.
ANR1991I Remote monitoring ended for server SPOKE1.
ANR0568W Session 123 for admin SPOKE1 (AIX) terminated -
connection with client severed.
Cause
The hub server is already managing status data and does not have enough resources to quickly manage more status data that is sent from the spoke servers.
Solution
Take one or more of the following actions:
- Increase the status refresh interval on all spoke servers by issuing the SET STATUSREFRESH command. The number of status updates that are sent from the spoke servers to the hub server decreases. Therefore, the load on the hub server decreases.
- Increase the ADMINCOMMTIMEOUT server option by issuing the SETOPT ADMINCOMMTIMEOUT command.
- Improve the performance of the hub server, or make another, more powerful server the hub server. Ensure that there is enough disk space for the server database. For information about requirements, search for "Effect of status monitoring on performance" in the Tivoli Storage Manager documentation.
Tip: Start by doubling the value of the option, and increase it gradually until the issue is solved.
Return to list
Symptoms
When you try to connect a spoke server to the hub server, error message ANR321E is displayed.
Cause
You might be using enterprise configuration with the following setup:
- The configuration manager server is the hub server.
- You defined a configuration profile that propagates administrator IDs from the configuration manager server to managed servers.
- You associated all administrator IDs with the configuration profile by specifying admins=* in the DEFINE PROFASSOCIATION command.
The Operations Center runs independently of enterprise configuration and attempts to register the monitoring administrator ID, IBM-OC-server_name, on the new spoke server. The error message is displayed because the monitoring administrator ID is managed by the configuration manager.
Solution
Do not specify admins=* in the DEFINE PROFASSOCIATION command when you associate administrator IDs with the configuration profile. Instead, list all administrator IDs, excluding the monitoring administrator ID, in the command. For example, admins=admin1,admin2,admin3,admin4. Make sure to update the list when administrator IDs are added to or removed from the hub server.
Symptom
On a server Overview page in the Operations Center, the "Activity Over 24 Hours" graphs report server activity even for periods of server downtime. The graphs include straight lines that connect the data points from before and after the downtime.
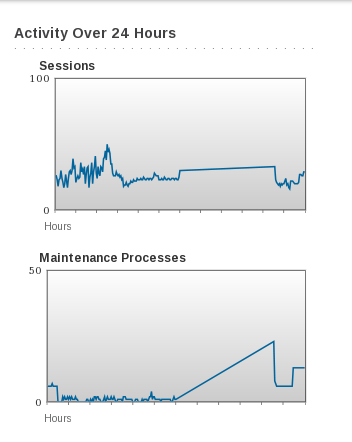
Cause
During downtime, the server does not generate data for the graphs. The graphing tool incorrectly fills the data gap with a straight line between the known values.
Solution
Recognize that the straight line is not a normal graph and represents server downtime.
Symptom
When you select a process or session on the server Active Tasks page of the Operations Center, no related messages are shown in the activity log pane. Alternatively, related messages are shown, but not the messages that were logged in the first minute after the server was restarted.
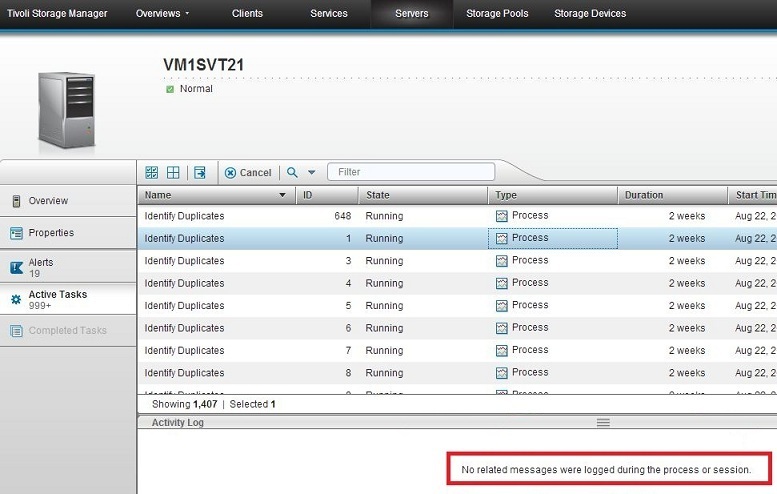
Cause
The activity log should show process-related or session-related messages that were logged since the last server restart time. The Operations Center calculates the last server restart time by subtracting server uptime from the current time. However, the value that is used for server uptime is updated only every 30 - 60 seconds, which results in an inconsistent restart time. Messages that were logged between the real server start time and the calculated server start time are not shown in the activity log.
Solution
Take one of the following actions:
- Wait for up to one minute for the initial messages to be displayed in the activity log. Note however that their display is intermittent.
- Display messages for a particular process or session by issuing the QUERY ACTLOG command. For example:
query actlog begindate=today-7 search="(PROCESS: 14)"
Return to list
Symptom
When you select tasks on the server Active Tasks page of the Operations Center and attempt to cancel them, the tasks are not canceled immediately.
Causes
The delay might be caused by one of the following situations:
- The canceled tasks remain in the table until the table is refreshed. The table is automatically refreshed every 30 seconds.
- You canceled many tasks together, and a delay is incurred as the associated commands are routed to the appropriate servers.
The table shows sample data from one test environment when an administrator canceled tasks. These results might differ from the results in your storage environment.
Table 2. Approximate delay times when tasks were canceled in a controlled environment
Number of tasks canceled | Delay for hub-server tasks | Delay for spoke-server tasks |
| 1 | 5 seconds | 5 seconds |
| 10 | 5 seconds | 7 seconds |
| 100 | 10 seconds | 25 seconds |
| 1000 | 40 seconds | 3.5 minutes |
For example, when the administrator selected 1000 hub-server tasks and clicked Cancel, it took approximately 40 seconds for the tasks to be canceled.
Solution
Wait until the tasks are canceled.
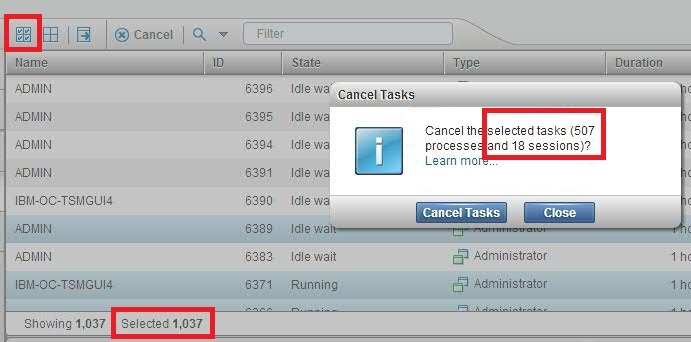
Symptom
On the server Active Tasks page of the Operations Center, the table contains many tasks, for example, 1000 tasks.
You display the optional Select All (![]() ) and Deselect All (
) and Deselect All (![]() ) icons. You click the Select All icon and then quickly click Cancel, to cancel all tasks.
) icons. You click the Select All icon and then quickly click Cancel, to cancel all tasks.
A message is displayed that requests you to confirm that you want to cancel the selected tasks. However, the number of tasks that the message quotes is less than the number of tasks that you selected.
Note: The number of tasks that you selected is displayed beneath the table.
Cause
When you clicked Cancel, the Operations Center had not finished selecting all tasks.
Solution
When you want to cancel all tasks, wait a few seconds after you click the Select All icon before you click Cancel.
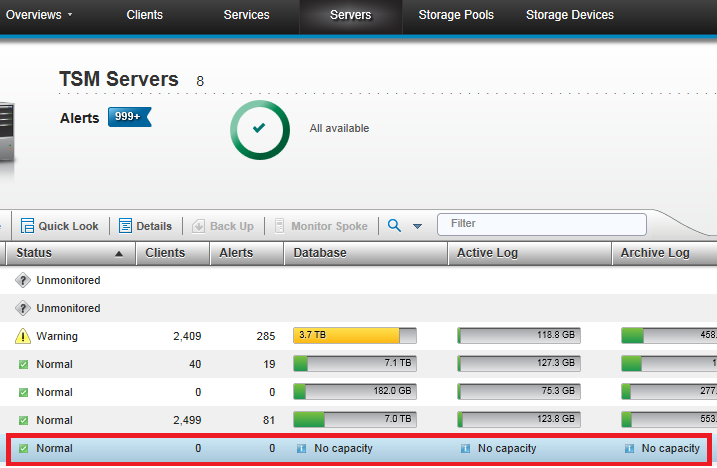
Symptom
On the Storage Pools page of the Operations Center, the capacity column indicates that storage pools have no capacity, even though capacity is defined for the storage pools.
Causes
Tivoli Storage Manager estimates the capacity of some storage pools to be zero until data is placed in the storage pools.
The problem arises when no data is stored in a storage pool in one of the following situations:
- One or more volumes are defined to the storage pool.
- The maximum number of scratch volumes that the storage pool can request is greater than zero.
Determine whether one of the listed causes is responsible for the symptoms by completing the following steps:
1. Display a list of volumes that are defined to a storage pool by issuing the following command:
query volume stgpool=pool_name
2. View the maximum number of scratch volumes that a storage pool can request, by completing the following steps:
a. From the Storage Pools page of the Operations Center, open the Quick Look window for the storage pool.
b. View the value of "Maximum scratch volumes."
Solution
If one of the listed causes is responsible for the symptoms, ignore the indication of no capacity for storage pools. When data is placed in the storage pool, the correct capacity is estimated and is shown on the Storage Pools page.
Symptoms
The following symptoms are present:
- On the Storage Devices page of the Operations Center, the Disk Storage column displays a warning or error icon.
- The Library Status column indicates that the library is offline.
- The Drives column indicates that drives are offline.
One of the following situations might be present:
- The server might not be able to allocate some scratch volumes for a device class. The percentage of scratch volumes that the server cannot allocate might have reached the warning or error threshold.
- The directories that the device class uses might not have enough space to fulfill the maximum number of possible scratch-volume requests.
Take one of the following actions:
- Add space to the directories that the device class uses.
- Lower the maximum number of scratch volumes that can be simultaneously mounted for the device class. You can lower this maximum by taking one of the following actions:
- Issue the UPDATE DEVCLASS command, and lower the value of the MOUNTLIMIT parameter.
- Issue the UPDATE STGPOOL command, and lower the value of the MAXSCRATCH parameter for all storage pools that use the device class.
- Increase the value of the thresholds that cause an error or warning to be reported when the server cannot allocate some scratch volumes. You can increase these thresholds by issuing the UPDATE STATUSTHRESHOLD command and by increasing the value of the FILEDEVCLASSPCTSCRUNALLOCATABLE parameter.
Return to list
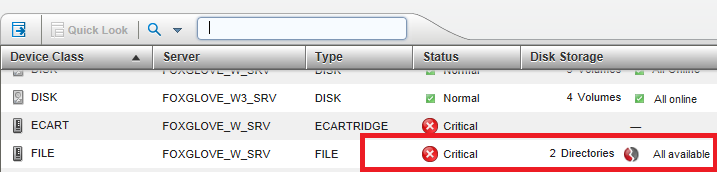
Symptom
On the Storage Devices page of the Operations Center, the Disk Storage column displays the following information in a row in which the type of storage device is FILE:
- The number of directories that are defined to the device class
- A warning or error icon
- The message "All available"
The warning or error icon seems to contradict the message that all directories are available.
Cause
Although there seems to be a contradiction between the warning or error icon and the message "All available," there is no contradiction.
- When a directory is unavailable, it cannot create any further scratch volumes.
- By default, a warning icon is displayed if the combined directories that are defined to the device class do not have enough space to fulfill 25% of possible scratch-volume requests. Similarly, by default, an error icon is displayed if the combined directories do not have enough space to fulfill 50% of possible scratch-volume requests.
Solution
To resolve the problem that is indicated by the warning or error icon, complete the following steps:
1. Issue the QUERY DEVCLASS command to view the following information:
- A list of the directories that are defined to the device class
- The estimated or maximum capacity of a volume that is associated with the device class
- The mount limit, which is the maximum number of sequential-access volumes that can be mounted concurrently
3. Determine whether the device class is at risk of exhausting the space available to fulfill possible scratch-volume requests.
Symptom
The activity log contains messages that seem to be out of place. For example:
05/22/2013 10:51:13 ANR2034E SELECT: No match found using this criteria.
(SESSION: 2)
05/22/2013 10:51:13 ANR2017I Administrator ADMIN issued command: ROLLBACK
(SESSION: 2)
Cause
When a command is issued to a Tivoli Storage Manager server, at least one ANR2017I message normally echoes the command in the server's activity log. However, for most commands that are issued from the Operations Center to a server, the ANR2017I message is not added in the activity log. The activity log is therefore kept uncluttered.
Some commands cause more than one message to be added to the activity log. When these commands are issued from the Operations Center, only the first, ANR2017I message is suppressed. The remaining messages remain in the activity log and are out of context.
For example, the following command might be issued from the Operations Center to a server:
select * from tsmgui_allsrv_grid where status=1
The first ANR2017I message in the following set of messages is not added to the activity log, which causes the second and third messages to be out of context:
05/22/2013 10:51:13 ANR2017I Administrator ADMIN issued command:
select * from tsmgui_allsrv_grid where status=1 (SESSION: 2)
05/22/2013 10:51:13 ANR2034E SELECT: No match found using this criteria.
(SESSION: 2)
05/22/2013 10:51:13 ANR2017I Administrator ADMIN issued command: ROLLBACK
(SESSION: 2)
Solution
Keep in mind that an ANR2017I message might be suppressed that would provide context for the remaining messages.
Symptom
In the command-line interface of the Operations Center, an out-of-memory message is displayed after you issue a SELECT command.
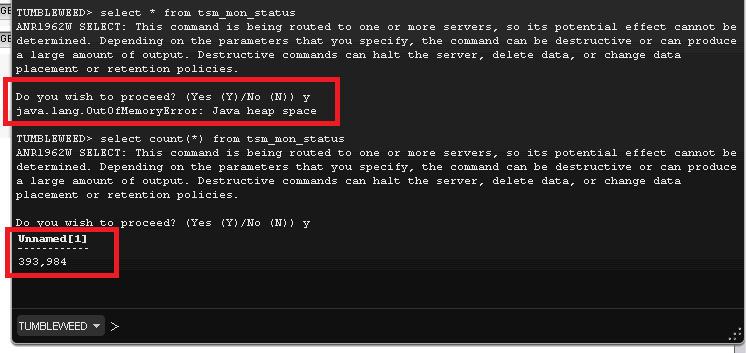
Cause
The SELECT command that you issued generated an output set that was too large for the Java™ virtual machine (JVM) heap space on the web server of the Operations Center.
Solution
Take one of the following actions:
- Issue the SELECT command from the command-line interface of the administrative client instead of from the command-line interface of the Operations Center.
- Increase the maximum heap size on the web server of the Operations Center. For information about increasing the maximum heap size, search for "JVM heap size" in the Tivoli Storage Manager documentation.
Return to list
Correction to the Operations Center installation instructions
| Page | Incorrect information | Correction |
| Planning to install the Operations Center > System requirements for the Operations Center > Operating system requirements | You can run the Operations Center on the following Linux x86_64 and IBM System z® systems:
| You can run the Operations Center on the following Linux x86_64 and IBM System z systems:
|
Corrections to server command help information
| Command | Location on page | Incorrect information | Correction |
| DEFINE STATUSTHRESHOLD | Value | You can specify an integer from 0 to 9223372036854775807. | You can specify an integer from 0 to 999999999999999. |
| SET ALERTACTIVEDURATION | number_mins | Specify a value from 1 to 99999. | Specify a value from 1 to 20160. |
| SET ALERTINACTIVEDURATION | number_mins | Specify a value from 1 to 99999. | Specify a value from 1 to 20160. |
| SET NODEATRISKINTERVAL | Interval | You can specify an integer from 6 to 8784. | You can specify an integer from 6 to 8808. |
| SET VMATRISKINTERVAL | Interval | You can specify an integer from 6 to 8784. | You can specify an integer from 6 to 8808. |
| SET STATUSATRISKINTERVAL | Interval | You can specify an integer from 6 to 720. | You can specify an integer from 6 to 8808. |
Corrections to server command help information
| Command | Location on page | Incorrect information | Correction |
| DEFINE ALERTTRIGGER and UPDATE ALERTTRIGGER | message_number | Wildcard characters can be used to specify message numbers. | Wildcard characters cannot be used to specify message numbers. |
| DEFINE ALERTTRIGGER, UPDATE ALERTTRIGGER, and QUERY ALERTSTATUS | CATegory | CAtalog Alert is classified as catalog category. | INventory Alert is classified as inventory category. |
| QUERY ALERTSTATUS | CATegory | A note is missing. | Note: The category of CAtalog is used instead of INventory in alerts from servers that were not upgraded to Tivoli Storage Manager 7.1.0 or later. |
Errors in the Operations Center embedded help information
There are several minor language inconsistencies in the embedded help system of V7.1.0 of the Operations Center. For example, the name "Operations Center" might sometimes be shown in English and sometimes in the language to which your browser is set.
Was this topic helpful?
Document Information
Modified date:
17 June 2018
UID
swg21651428