Troubleshooting
Problem
You need to collect CPU data for problems with the IBM® WebSphere® Application Server 100% CPU usage component on Microsoft Windows® 2003 Server or XP platforms. Gathering this information before calling IBM support will help you understand the problem and save time analyzing the data.
Resolving The Problem
The MustGather for high CPU and performance issues has moved to a new URL :
MustGather: Performance, Hang, or High CPU Issues on Windows
Windows XP/NT®/2003 includes a performance viewer (part of the Microsoft management console) that can be used to determine which threads in a Java process are consuming the CPU.
Collect the following information when the problem is with the application server process:
- From the Start menu, select Programs > Administrative Tools > Performance Monitor.
(Alternatively, you might find Start > Settings > Control Panel, double-click Administrative Tools, and double-click Performance to open the Performance Monitor tool). A new performance monitor window titled Performance will be opened.
- Performance data can be captured to a log file. The log file can be forwarded to a location for analysis and rerun through the performance monitor. From the performance monitor window, expand Performance logs and alerts, right-click Counter Logs, New Log Settings.
- Type a log setting name, then click OK. A new window titled with the name you provided will now be opened.
- Click Add to add counters on the window opened in the above step. A new window titled Add Counters will now be opened.
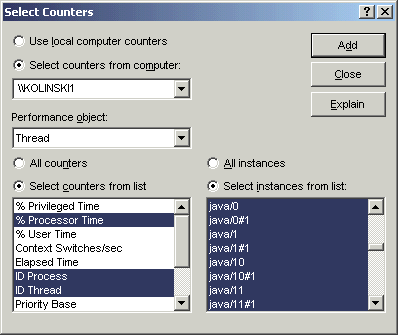
- In the Performance Object drop down, select Thread as Object.
- Click Select counter from List (default), then select the following counters:
Counter = % Processor Time
Counter = ID Process
Counter = ID Thread
- Click Select instances from list and select all Java threads as shown in this example:

- Click Add to add new properties, then click Close.
- Logging starts immediately.The log file icon turns green.
- Collect the other performance data following MustGather: Performance, Hang, or High CPU Issues on Windows
- Once Performance Degradation documentation is collected, end the Performance Monitor logging. From the Performance Monitor tool, right-click Log Name in the counter window, then click Stop. The log file to send to IBM is referenced in the Log File Name column.
- Collect the the perfmon log
- Follow instructions to send diagnostic information to IBM support.
Analyzing the data
Using the tool to determine the thread consuming high CPU
You can use the "Performance Analysis Tool for Java" for determining the threads taking high CPU.
Manually determine the thread consuming high CPU
1. To review the log, open the performance log file using perfmon. "Perfmon" is a tool provided by Microsoft and shipped as part of the operating system. It is usually located in the system32 folder.
2. On the main screen titled "Performance", click the "View Log File Data" icon (cylinder shaped). This will open System Monitor View, where you should click on the "Log Files" radio button. Then click on "Add" to select the log file.
3. Now back on the main "perfmon" screen titled "Performance", click the plus ( + ) button. In the "Add Counters" window, select the following items:
Performance Object = Thread
Click on Radio button: "Select counters from list" and select the three listed counters:
Counter = % Processor Time
Counter = ID Process
Counter = ID Thread
And select all instances.
Then click on "Add" and close the "Add Counters" window.
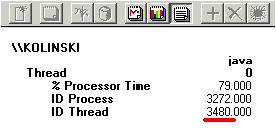
On the main screen titled "Performance", click the "View Reports" icon to determine the thread ID that consumes the CPU

4. Convert the thread ID (3480) to hexadecimal using the Windows calculator
3480 in decimal = D98 in hex
5. In the javacore.txt file, locate the thread that has a native ID of 0xD98
For example:
"SoapConnectorThreadPool : 0" (TID:0x10A25A98, sys_thread_t:0x24A31B30, state:R, native ID:0xD98) prio=5
Review the stack of that thread in each javacore to determine the cause of the CPU usage.
For a listing of all technotes, downloads, and educational materials specific to the 100% CPU Usage issue, search the WebSphere Application Server support site.
Related Information
Was this topic helpful?
Document Information
Modified date:
15 June 2018
UID
swg21137447